Matplotlib is a matlab-like plotting library for python. It can create both 2D and 3D plots, with the help of matplotlib pyplot. Matplotlib can be used in interactive environments such as IPython notebook, Matlab, octave, qt-console and wxpython terminal. Matplotlib has a modular architecture with each layer having its own dependencies which makes matplotlib very versatile and allows users to use only those modules they need for their applications. matplotlib provides many hooks that allow developers to customize matplotlib features as they need. Matplotlib architecture has a clear separation between user interface and drawing code which makes it easy to customize or create new interfaces for matplotlib. In this blog post, we will discuss matplotlib pyplot plot example with the python code sample.
What is Matplotlib Pyplot Plot function?
Matplotlib.pyplot is a matplotlib module for matlab style plotting. The function plot in pyplot module takes in a list of named (*args) and unnamed arguments (**kwargs) and is represented as plot(*args, **kwargs).
There are two different ways of plotting using Pyplot plot function.
- Using plot function while interacting with Pyplot scripting interface
- Get figure and axes object and use plot function while interacting with PyPlot scripting interface
- Use plot function while interacting with PyPlot artist layer
Here are few important points which need to be understood in relation to pyplot module and plot function:
- Pyplot can retrieve current figure with the function gcf() and current axis with the function, gca(). Note that gcf stands for get current figure, and gca stands for get current axis. It keeps plot of both figure and axis object and one can get them whenever it is required using gcf() and gca() function.
- When you invoke plot function on PyPlot module, it internally invokes plot() function on the axis object underneath.
Use plot function while interacting with Pyplot scripting interface
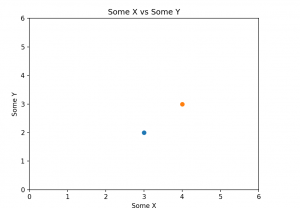
Pyplot module as a function called as plot. The Here is a sample code for using plot function while interacting with scripting layer of Matplotlib. Note that the call to plot function internally creates figure object, add subplot and axis in the artist layer. Post that, invoking functions such as xlabel, ylabel, title etc adds the information to the current axis tracked by the pyplot. In the code below, the plot function plots the data point (3, 2) using a third argument ‘o’ which determines how the data point will be rendered. If the %matplotlib notebook is used, then subsequent to plot calls will update the same plot. It provides interactive backend which using which the same plot gets updated. In case, %matplotlib inline is used, everytime a call to plot function is made, a new plot is created.
%matplotlib notebook
import matplotlib.pyplot as plt

plt.plot(3, 2, 'o')
plt.plot(4, 3, 'o')
plt.axis([0, 6, 0, 6])
plt.xlabel('Some X')
plt.ylabel('Some Y')
plt.title('Some X vs Some Y')
Here is how the plot looks like:

Get figure & axis object and use plot function while interacting Pyplot scripting interface
Here is a sample code for using the plot function while interacting with the scripting layer of Matplotlib. In this case, you explicitly get the figure object by invoking the figure() method on pyplot instance. Then, add the subplots and axis and draw the plot. Here is the sample code:
%matplotlib notebook
import matplotlib.pyplot as plt

# Create the new figure object
#
plt.figure()
# Add the sub plots in the figure
#
plt.plot(3, 2, 'o')
plt.plot(4, 3, 'o')
# Get the axis
#
ax = plt.gca()
ax.axis([0, 6, 0, 6])
# Set the label and title
#
plt.xlabel('Some X')
plt.ylabel('Some Y')
plt.title('Some X vs Some Y')
Here is how the plot looks like:

Make a note of some of the following in the above plot:
- plt.figure() helps you to create a new figure object and add the subplots and axis. In case, you want to get existing figure object, call the method plt.gcf()
- plt.gca() helps you to get current axis (gca)
There is also another way of creating the plot by directly interacting with the artistic layer backend.
Use plot function while interacting with Pyplot artist layer
One of the layers of Matplotlib modular architecture is the artist layer which is responsible for drawing matplotlib graphs. The artist layer consists of figures, subplots, axes, and data points. The data points are rendered as patches on these axes. Here is the sample code which represents how to draw plots by directly interfacing with the artist layer. In the code below, a new backend object called FigureCanvasAgg and a figure object called Figure are imported. Also, note that the backend is not able to render it directly. So, the plot is written in an image file. Recall that when the plot function is called on the pyplot module, it is the plot function on the axis object which gets invoked. Note how the plot function is invoked on the axis object in the code given below.
from matplotlib.backends.backend_agg import FigureCanvasAgg
from matplotlib.figure import Figure
#
# Create a figure object and associate with the backend
#
fig = Figure()
canvas = FigureCanvasAgg(fig)
#
# Add subplot. 111 represents that only one subplot is created.
#
ax = fig.add_subplot(111)
ax.plot(3, 2, '.')
canvas.print_png('test.png')
The above plot can then be rendered using the following code:
%%html
<img src='test.png' />

Check out my latest book titled as First Principles Thinking: Building winning products using first principles thinking.
- Three Approaches to Creating AI Agents: Code Examples - June 27, 2025
- What is Embodied AI? Explained with Examples - May 11, 2025
- Retrieval Augmented Generation (RAG) & LLM: Examples - February 15, 2025
I found it very helpful. However the differences are not too understandable for me