In this post, you will learn the techniques in relation to knowing whether the given data set is linear or non-linear. Based on the type of machine learning problems (such as classification or regression) you are trying to solve, you could apply different techniques to determine whether the given data set is linear or non-linear. For a data scientist, it is very important to know whether the data is linear or not as it helps to choose appropriate algorithms to train a high-performance model. You will learn techniques such as the following for determining whether the data is linear or non-linear:
- Use scatter plot when dealing with classification problems
- Use scatter plots and the least square error method applied in a simple regression method when dealing with regression problems.
Use Scatter Plots for Classification Problems
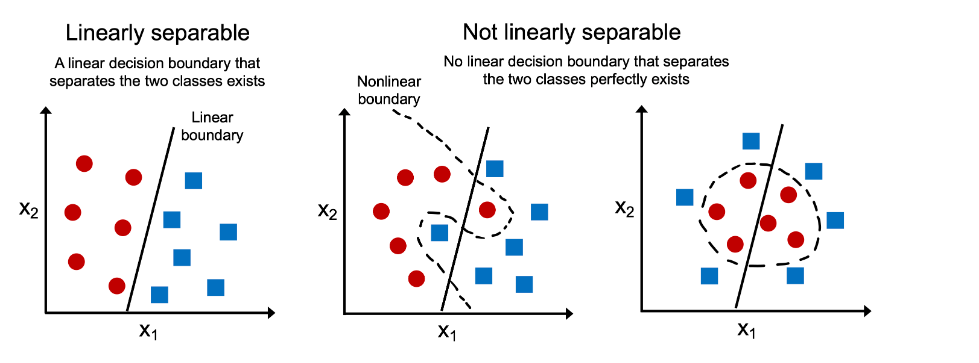
In the case of the classification problem, the simplest way to find out whether the data is linear or non-linear (linearly separable or not) is to draw 2-dimensional scatter plots representing different classes. Here is a picture that represents the linearly and non-linearly separable dataset and how one can use scatter plots to visualize them.
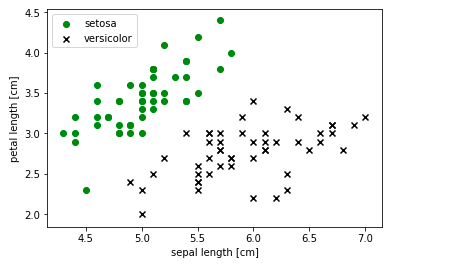
Here is an example of a linear data set or linearly separable data set. The data set used is the IRIS data set from sklearn.datasets package. The data represents two different classes such as Setosa and Versicolor. Note that one can easily separate the data represented using black and green marks with a linear hyperplane/line.
The code which is used to print the above scatter plot is the following:
import pandas as pd
import numpy as np
from sklearn import datasets
import matplotlib.pyplot as plt

# Load the IRIS Dataset
#
iris = datasets.load_iris()
X = iris.data
y = iris.target

# Create a scatter plot
#
plt.scatter(X[:50, 0], X[:50, 1], color='green', marker='o', label='setosa')
plt.scatter(X[50:100, 0], X[50:100, 1], color='black', marker='x', label='versicolor')
plt.xlabel('sepal length [cm]')
plt.ylabel('petal length [cm]')
plt.legend(loc='upper left')
plt.show()
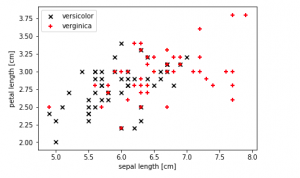
Here is an example of a non-linear data set or linearly non-separable data set. The data set used is the IRIS data set from sklearn.datasets package. The data represents two different classes such as Virginica and Versicolor. Note that one can’t separate the data represented using black and red marks with a linear hyperplane. Thus, this data can be called as non-linear data.

The code which is used to print the above scatter plot to identify non-linear dataset is the following:
import pandas as pd
import numpy as np
from sklearn import datasets
import matplotlib.pyplot as plt

# Load the IRIS Dataset
#
iris = datasets.load_iris()
X = iris.data
y = iris.target

# Create a scatter plot
#
plt.scatter(X[50:100, 0], X[50:100, 1], color='black', marker='x', label='versicolor')
plt.scatter(X[100:150, 0], X[100:150, 1], color='red', marker='+', label='verginica')
plt.xlabel('sepal length [cm]')
plt.ylabel('petal length [cm]')
plt.legend(loc='upper left')
plt.show()
Use Simple Regression Method for Regression Problem
Linear data is data that can be represented on a line graph. This means that there is a clear relationship between the variables and that the graph will be a straight line. Non-linear data, on the other hand, cannot be represented on a line graph. This is because there is no clear relationship between the variables and the graph will be curved.
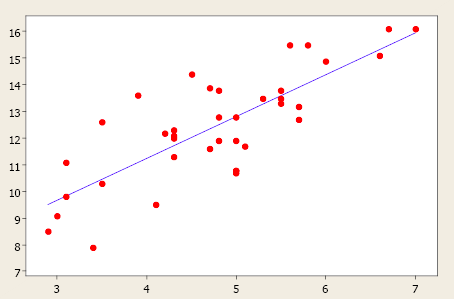
In case you are dealing with predicting numerical value, the technique is to use scatter plots and also apply simple linear regression to the dataset, and then check the least square error. If the least square error shows high accuracy, it can be implied that the dataset is linear in nature, else the dataset is non-linear. Here is how the scatter plot would look for a linear data set when dealing with a regression problem.
In addition to the above, you could also fit a regression model and examine the statistics such as R-squared, adjusted R-squared, F-statistics, etc to validate the linear relationship between response and the predictor variables. For instance, if the value of F-statistics is more than the critical value, we reject the null hypothesis that all the coefficients = 0. This means that there exists some linear relationship between the response and one or more predictor variables. You may want to check out this post to learn greater details.
While linear data is relatively easy to predict and model, non-linear data can be more difficult to work with. However, non-linear data can also provide more insight into complex systems.

Check out my latest book titled as First Principles Thinking: Building winning products using first principles thinking.
- Questions to Ask When Thinking Like a Product Leader - July 3, 2025
- Three Approaches to Creating AI Agents: Code Examples - June 27, 2025
- What is Embodied AI? Explained with Examples - May 11, 2025
Hello Ajitesh,
Good Explanation.
Just one doubt. R square = 1 , means, variance in data(target(dependent)) is 100% explained/accounted by the independent varaibles.
How will it tell data is linear or not??
Thanks Satvik for bringing up the point. Valid question. We may also need to look at other statistics such as F-statistics, adjusted R-squared etc to understand the regression model in a better manner including the relationship between response and the predictor variables. For example, if the value of f-statistics is more than the critical value, we reject the null hypothesis that all the coefficients = 0. This means that there exists some linear relationship between the response and one or more predictor variables. You may want to check out this post to learn greater details. https://vitalflux.com/interpreting-f-statistics-in-linear-regression-formula-examples/
Hello Mr.Ajitesh Kumar,
Thank you for your article with good explanation.
The example on your article we can do draw 2-dimensional scatter plots, but how about to know data microarray with many many feature/variable linear or not.
Thanks in advance