
Clustering is a type of unsupervised machine learning technique that is used to group data points into distinct categories or clusters. It is one of the most widely used techniques in machine learning and can be used for various tasks such as grouping customers by their buying habits, creating groups of similar documents, or finding groups of related genes. In this blog post, we will explore different types / categories of clustering methods and discuss why they are so important in the field of machine learning.
Prototype-based Clustering
Prototype based clustering represents one of the categories of clustering algorithms that are used to identify groups within a larger dataset. This technique takes its inspiration from prototype theory, which states that the best way to describe a class is by identifying one “prototype” example. Prototype based clustering algorithms create a set of centroids or medoids within the data set to represent each prototype. The centroid represents the average of similar points with continuous features. The medoid represents the point that minimizes the distance to all other points that belong to a particular cluster in the case of categorical features. Using this metric, the algorithm can determine which data points are closest to each other and from that generate clusters.
Prototype based clustering most commonly uses K-means clustering. K-means clustering is one particular type of prototype based clustering. This algorithm seeks to minimize variance within each cluster by repeatedly making small adjustments to the centroid positions until they reach an optimal configuration. One of the drawbacks of K-means clustering algorithm is that we have to specify the number of clusters, K, a priori. K-means algorithm can be summarized as following:
- Randomly pick K centroids from the examples as initial cluster centers.
- Assign each example to the nearest centroid,
 .
. - Move the centroids to the center of the examples that were assigned to it.
- Repeat the above two steps 2 and 3 until the cluster assignments do not change or a user-defined tolerance or maximum number of iterations is reached.
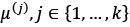
The techniques such as the elbow method and silhouette plots, can be used to evaluate the quality of clustering and determine the optimal number of clusters, K. Here is a sample code for creating K-means clusters and potting them along with centroids. Also, find the plot created as part of executing the code.
from sklearn.cluster import KMeans
from sklearn.datasets import make_blobs
import matplotlib.pyplot as plt
#
# Create 350 randomly generated points (n_samples=350)
# Grouped into 3 regions (centers=3)
X, y = make_blobs(n_samples=250,
                   n_features=3,
                   centers=3,
                   cluster_std=0.5,
                   shuffle=True,
                   random_state=0)
#
# Train with K-means clustering
#
km = KMeans(n_clusters=3,
             init='random',
             n_init=10,
             max_iter=300,
             tol=1e-04,
             random_state=0)
y_km = km.fit_predict(X)
#
# Plot K-means clusters with Centroids
#
plt.scatter(X[y_km == 0, 0],
             X[y_km == 0, 1],
             s=50, c='lightgreen',
             marker='s', edgecolor='black',
             label='Cluster 1')
plt.scatter(X[y_km == 1, 0],
             X[y_km == 1, 1],
             s=50, c='orange',
             marker='o', edgecolor='black',
             label='Cluster 2')
plt.scatter(X[y_km == 2, 0],
             X[y_km == 2, 1],
             s=50, c='lightblue',
             marker='v', edgecolor='black',
             label='Cluster 3')
plt.scatter(km.cluster_centers_[:, 0],
             km.cluster_centers_[:, 1],
             s=250, marker='*',
             c='red', edgecolor='black',
             label='Centroids')
plt.legend(scatterpoints=1)
plt.grid()
plt.tight_layout()
plt.show()
Hierarchical Clustering
Hierarchical clustering is another type of unsupervised learning technique that works by creating a hierarchy of clusters in form of hierarchical tree. The advantages of this type of clustering over prototype based clustering are the following:
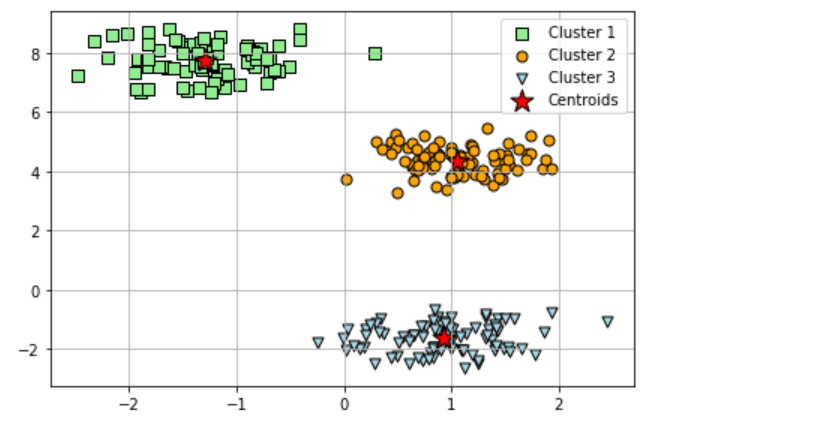
- It enables to plot dendrograms which greatly helps with the interpretation of the results by creating meaningful taxonomies. Dendrograms are tree-like diagrams used to represent the result of a hierarchical clustering algorithm. Each branch of the tree represents a cluster, and the leaves represent individual data points. The placement of each data point is determined by its similarity to the other points in the cluster. Dendrograms are typically used to visualize the results of hierarchical clustering algorithms, as they provide a clear way to see the structure of the clusters. Here is a picture representing dendrogram.

- It does not require to provide number of clusters upfront as like prototype based clustering.
There are two different kind of hierarchical clustering. They are as following:
- Agglomerative hierarchical clustering: Agglomerative hierarchical clustering is a type of cluster analysis that is used to group data points into clusters. The algorithm starts by assigning each data point to its own cluster (each cluster having only one data point) and then repeatedly merges the closest clusters until all data points are in one cluster. This is opposite to divisive hierarchical clustering. The agglomerative hierarchical clustering algorithm has many benefits, including its ability to handle small data sets, its flexibility, and its interpretability. Additionally, agglomerative hierarchical clustering is relatively fast and computationally simple. However, the algorithm does have some limitations, such as its sensitivity to outliers and its lack of scalability. Despite these limitations, agglomerative hierarchical clustering is a powerful tool that can be used to group data points in a variety of applications. The two standard algorithms for agglomerative hierarchical clustering are single linkage and complete linkage. In single linkage, the distances between the most similar members for each pair of clusters is computed and the two clusters for with the smallest distance between the most similar members are merged. The complete linkage approach is similar to single linkage but, instead of comparing the most similar members in each pair of clusters, the most dissimilar members in each cluster are compared to perform the merge into one cluster.
- Divisive hierarchical clustering: Divisive hierarchical clustering is a machine learning algorithm that can be used to cluster data points into groups. Unlike other clustering algorithms, divisive hierarchical clustering starts with all data points in one cluster or group and then splits the cluster iteratively into smaller subgroups until each data point is in its own group or each cluster consists only one data point. This has the benefit of being able to more accurately cluster data points that are similar to each other. However, it can also be more computationally expensive than other algorithms. When deciding whether or not to use divisive hierarchical clustering, it is important to consider the trade-off between accuracy and computational cost. In general, divisive hierarchical clustering is best used when the data set is small and the similarity between data points is high.
Density-Based Clustering
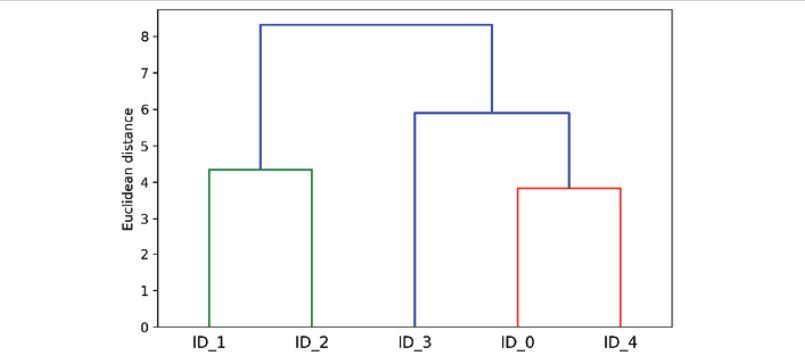
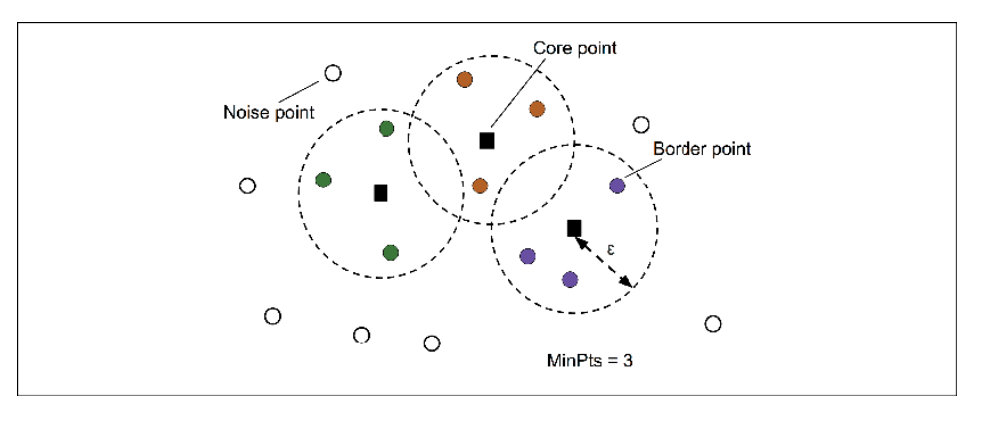
Density-based clustering is an algorithm that uses density to identify clusters in datasets where points are close together but have no clear boundaries separating them from other data points. Density based clustering gets its name from DBSCAN. DBSCAN (Density-Based Spatial Clustering of Applications with Noise) is an example of this type of algorithm and it works by assigning each point a minimum number of neighbors before considering it part of a cluster. As the name implies, density-based clustering assigns cluster labels based on dense regions of points. In DBSCAN, the notion of density is defined as the number of points within a specified radius, ![]() (epsilon).
(epsilon).
The following is how DBSCAN or density-based clustering works:
- First and foremost, a point is classified into core, border or noise points.
- Core point is a point if it falls within a specified radius
 (epsilon) with at least a specified number (MinPts) of neighboring points.
 - A border is considered as a border point if it has fewer neighbors than MinPts within ε, but lies within the
 radius of a core point.
 - All other points that are neither core or border are considered as noise points.
- Core point is a point if it falls within a specified radius
- As a next step, separate clusters are formed for each core point or connected group of core points. (Core points are connected if they are no farther away than the epsilon – specified radius)
- Each border point is assigned to the cluster of its corresponding core point.
Distribution-based Clustering
Distribution based clustering is a type of hierarchical clustering that is used when the distribution of data points is known such as Gaussian or normal distribution. It is based on the concept of dividing data into clusters, where each cluster has a mean and variance. The following picture three different distribution based clusters.
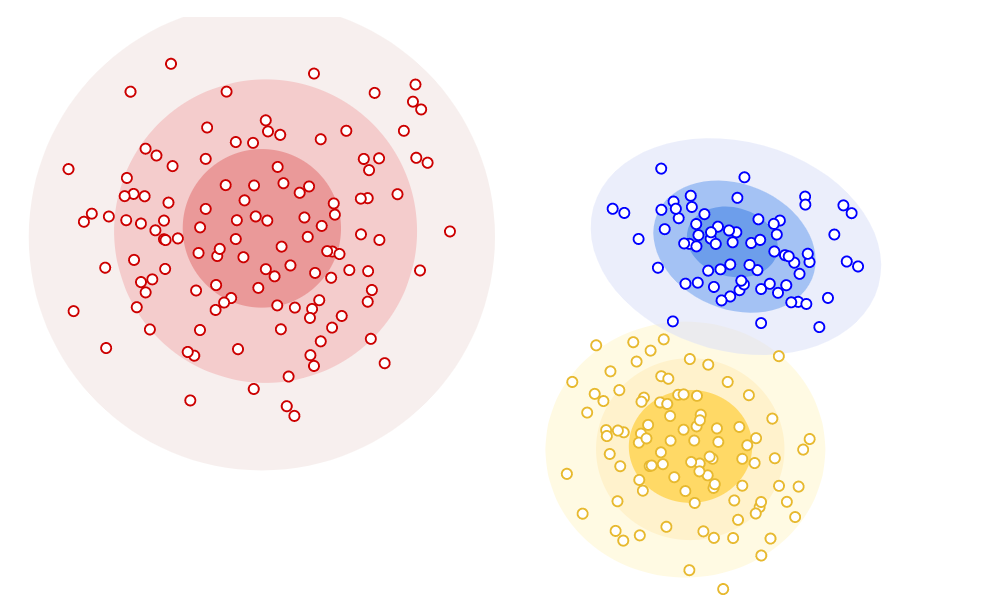
The benefits of using distribution based clustering include the ability to handle large datasets, the ability to identify non-linear relationships, and the ability to identify outliers.
Conclusion
Clustering algorithms are essential tools for any machine learning engineer or data scientist looking to uncover trends and patterns within their dataset without relying on manual labeling or supervised classification methods. By understanding different types of clustering algorithms such as prototype-based, hierarchical, distribution based and DBSCAN, you will be able to apply these techniques to your own projects with confidence and accuracy. With enough practice, you’ll soon be uncovering insights in your data no one else has ever seen before!

Check out my latest book titled as First Principles Thinking: Building winning products using first principles thinking.
- Three Approaches to Creating AI Agents: Code Examples - June 27, 2025
- What is Embodied AI? Explained with Examples - May 11, 2025
- Retrieval Augmented Generation (RAG) & LLM: Examples - February 15, 2025
I found it very helpful. However the differences are not too understandable for me