I have tried to configure many a times, Zend studio with XDebug due to various reasonss, most common being my computer getting crashed. And, everytime, I found myself reinventing the wheel after I got exhausted to figure out if I noted the configurations somewhere.
This blog is for me to refer back whenever my laptop crashes again and I have to reconfigure Zend Studio, PHP and XDebug.
Following entities will change:
- Downloading of XDebug DLL and placing the same in ext folder of php installation
- PHP INI file
- Zend Studio Debug Preferences
Lets go over each one of them in detail:
- Download relevant XDebug dll from thos page. http://xdebug.org/download.php. The downloadable depends upon php version and windows configuration. Mine is 64 bit, PHP 5.3 So, I downloaded http://xdebug.org/files/php_xdebug-2.2.1-5.3-vc9-x86_64.dll. Just FYI, if you try downloading incompatible version, there are chances of exception when you try to start HTTPD. Once downloaded, place the dll file in <PHP_Installation_HOME>/ext
- Put following configuration in your PHP INI file:
[XDEBUG]
zend_extension=”D:\PHP\ext\php_xdebug-2.2.1-5.3-vc9-x86_64.dll”
xdebug.remote_enable=1
xdebug.remote_host=localhost
xdebug.remote_port=9000
xdebug.remote_handler=dbgp
xdebug.remote_autostart=1
xdebug.remote_mode=req
To know more about xdebug remote options, visit the page http://xdebug.org/docs/remote.
- Do the following with Zend Studio:
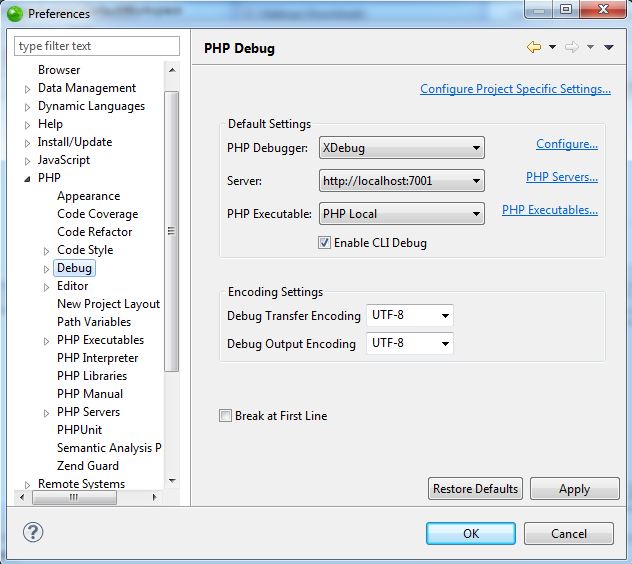
b. Go to PHP/Debug
c. In PHP/Debug window, 1. change the debugger to XDebug by selecting from drop down list. 2. change the server configuration to point to your local server. I fixed it to localhost:7001. You do that by clicking on “PHP Servers…” link, and then creating an entry for localhost:7001. Further to that, you click on localhost:7001 and set the information for Base URL and Local Web Root 3.You set the configuration for local php installation. This is done by going within link “PHP Executables…” where you create a new entry and may name it as PHP Local. Then you double click on the new entry and enter the details for following: a> Name b> Executable Path c> PHP ini file d> SAPI Type (select CLI) e> PHP Debugger (select XDebug).
- The Watermelon Effect: When Green Metrics Lie - January 25, 2026
- Coefficient of Variation in Regression Modelling: Example - November 9, 2025
- Chunking Strategies for RAG with Examples - November 2, 2025


This setup does not work with Zend Studio 10.5.0 and PHP Version 5.4.16 with Xdebug v2.2.3.