
Information retrieval systems including the ones related to semantic search aim to fetch the most relevant documents from a collection based on a user query. To measure the performance of these systems, various evaluation metrics such as Mean Average Precision (MAP), and Normalized Discounted Cumulative Gain (nDCG) are used. Mean Average Precision (MAP) is a popular metrics that quantifies the quality of ranked retrieval results. In this blog, we will look into the intricacies of MAP, its application in semantic search and information retrieval, and we’ll walk through a simple Python example to calculate MAP.
What is Mean Average Precision (MAP) Method?
Whether we’re talking about classic information retrieval or semantic search, MAP is a widely accepted performance measure.
In information retrieval, searches can be based on full-text or other content-based indexing. The science of searching for information in a document, searching for the documents themselves, and also searching for the metadata that describes data. In semantic search, the aim is to improve search accuracy by understanding the searcher’s intent and the contextual meaning of terms to generate more relevant results. This is achieved by considering various factors including context of search, location, intent, variation of words, synonyms, generalized and specialized queries, concept matching, and natural language queries.
In both these contexts, MAP serves as a reliable measure to evaluate the quality of the search results.
MAP is a measure used in information retrieval that averages the precision scores at each rank where a relevant document is found. Precision here is the fraction of retrieved documents that are relevant to the user’s query. Average precision (AP) is first calculated for each query, and then the mean of these values across different queries gives us the MAP.
The important point to note is that average precision (AP), and therefore MAP, doesn’t just consider the number of relevant documents retrieved, but also the order in which they were retrieved. A system that returns relevant documents higher in the ranking is rewarded with a higher MAP score.
How to Calculate Mean Average Precision Score?
Let’s consider a simple example where a search result returns five documents. The ranked list of these documents, with relevance indicated, is {Relevant, Non-relevant, Non-relevant, Relevant, Non-relevant}.
The AP is calculated as follows:
- At rank 1 (the first document), precision = 1/1 = 1.0 (since the first document is relevant).
- At rank 4 (the fourth document), precision = 2/4 = 0.5 (we have two relevant documents by this point).
Then the AP for this query is calculated by summing the precision scores at the ranks where relevant documents were found and dividing by the total number of relevant documents:
AP = (1.0 (at rank 1) + 0.5 (at rank 4)) / 2 (total relevant documents) = 0.75.
The MAP is the mean of the APs for all queries. In this case, with only one query, the MAP equals the AP.
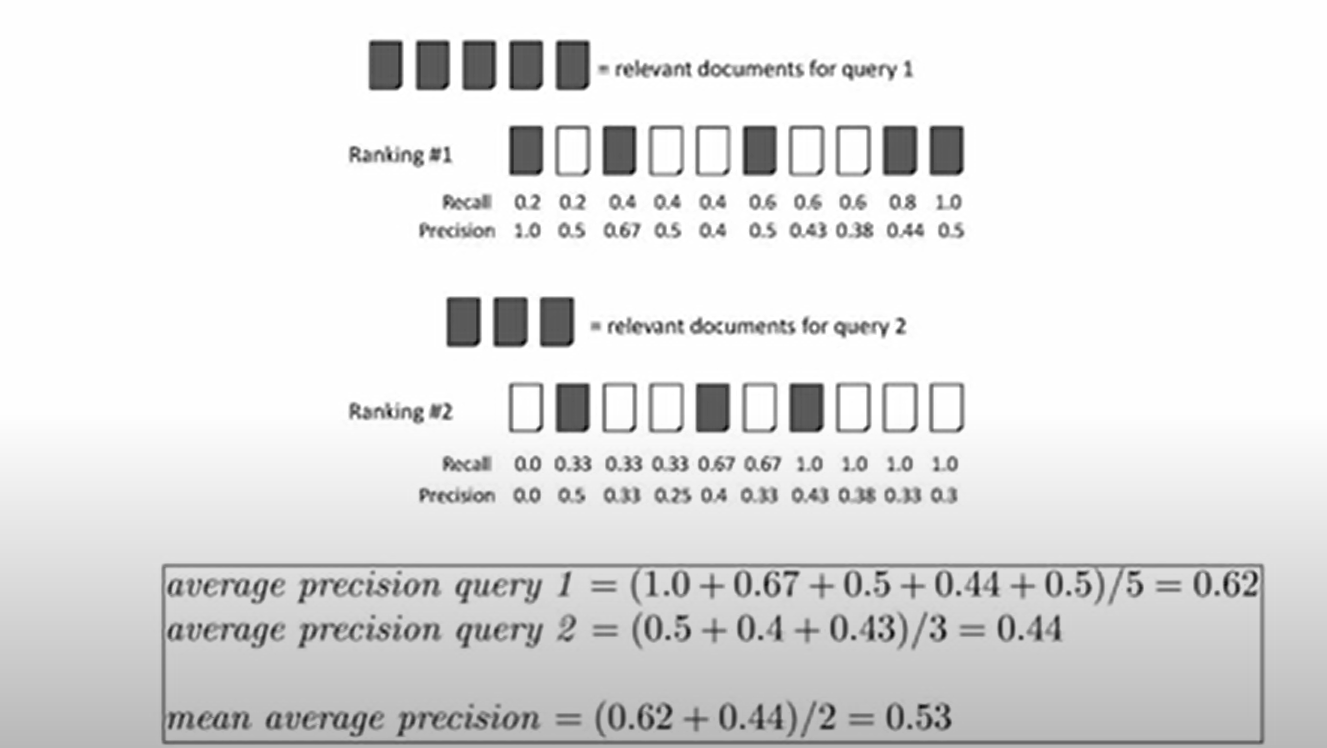
The following is an image discussed in the video, Mean Average Precision. Explains the concept very nicely.
Why learn Mean Average Precision concepts? What’s the importance?
Mean Average Precision (MAP) is an essential concept for data scientists, particularly those who are working with information retrieval systems, recommendation systems, natural language processing, and machine learning models. Understanding and being able to calculate MAP is important for several reasons:
- Evaluation Metric: MAP is a standard evaluation metric in information retrieval tasks. It’s used to assess the overall performance of search algorithms and systems, taking into account not just whether the relevant items were retrieved, but also the order in which they were retrieved. This makes it a more robust metric than simply looking at precision or recall.
- Ranking Quality: MAP is sensitive to the ranking of the results. This is important in many real-world applications where the position of an item in the returned list matters. For example, in search engines, the top results are more likely to be clicked by the user.
- Aggregated Measure: MAP calculates the mean of the average precision scores for each query, thereby providing an aggregated measure to evaluate the system’s performance across multiple queries. This allows for a more comprehensive evaluation.
- Model Comparison: MAP can be used as a metric to compare different models or algorithms, helping data scientists to decide which model performs better and should be chosen for deployment.
Python Code for Calculating MAP
Here’s a simple Python function to calculate MAP:
def calculate_map(ranked_lists):
    ap_sum = 0
    for ranked_list in ranked_lists:
        precision_sum = 0
        relevant_docs = 0
        for i, doc in enumerate(ranked_list):
            if doc == 1:  # doc is relevant
                relevant_docs += 1
                precision_sum += relevant_docs / (i + 1)
        ap_sum += precision_sum / relevant_docs
    map = ap_sum / len(ranked_lists)
    return map

# Using the function with the ranked list from our example:
ranked_lists = [[1, 0, 0, 1, 0]]  # 1 for Relevant, 0 for Non-relevant
print(calculate_map(ranked_lists))  # Outputs: 0.75
Conclusion
Mean Average Precision (MAP) is an invaluable tool in the data scientist’s toolkit, particularly for those who work in the field of information retrieval and natural language processing. Its sensitivity to the ranking of search results, coupled with its ability to aggregate results across multiple queries, makes it a robust metric for assessing the performance of search systems and algorithms. Understanding MAP allows data scientists to critically evaluate and compare different models, and optimize their algorithms for better performance. Moreover, being aware of such metrics equips professionals to justify their models’ performance and make informed decisions when deploying these models in real-world scenarios.
However, like all evaluation metrics, MAP has its limitations and is not always the perfect choice for every situation. It’s important for data scientists to understand the context in which they are working, the specific task at hand, and the limitations of their chosen metrics. Only then can they choose the most appropriate metrics for their specific tasks. The value of metrics like MAP goes beyond just numbers. They facilitate a more profound understanding of models and their performance, paving the way for more advanced and efficient algorithms. As the field of data science continues to grow and evolve, so will the tools and metrics we use, continually pushing the boundaries of what’s possible.

Check out my latest book titled as First Principles Thinking: Building winning products using first principles thinking.
- Three Approaches to Creating AI Agents: Code Examples - June 27, 2025
- What is Embodied AI? Explained with Examples - May 11, 2025
- Retrieval Augmented Generation (RAG) & LLM: Examples - February 15, 2025
I found it very helpful. However the differences are not too understandable for me