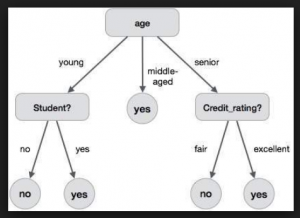
Decision tree is one of the most commonly used machine learning algorithms which can be used for solving both classification and regression problems. It is very simple to understand and use. Here is a lighter one representing how decision trees and related algorithms (random forest etc) are agile enough for usage.
Figure 1. Trees and Forests
In this post, you will learn about some of the following in relation to machine learning algorithm – decision trees vis-a-vis one of the popular C5.0 algorithm used to build a decision tree for classification. In another post, we shall also be looking at CART methodology for building a decision tree model for classification.
The post also presents a set of practice questions to help you test your knowledge of decision tree fundamentals/concepts. It could prove to be very useful if you are planning to take up an interview for machine learning engineer or intern or freshers or data scientist position.
What is decision tree algorithm?
Decision tree is a machine learning algorithm used for modeling dependent or response variable by sending the values of independent variables through logical statements represented in form of nodes and leaves. The logical statements are determined using the algorithm. Decision tree algorithm, as like support vector machine (SVM) can be used for both classification and regression tasks and even multioutput tasks.
Decision tree algorithm is implemented using Sklearn Python package such as the following:
- DecisionTreeRegressor (sklearn.tree.DecisionTreeRegressor)
- DecisionTreeClassifier (sklearn.tree.DecisionTreeClassifier)
Decision trees are fundamental components of random forests.
Key Definitions – Decision Trees
- Divide and Conquer: It is a strategy used for splitting the data into two or more data segments based on some decision. IT is also termed as recursive partitioning. The splitting criterion used in C5.0 algorithm is entropy or information gain which is referred in detail in this post.
The splitting criterion used in C5.0 algorithm is entropy or information gain which is described later in this post.
- Entropy: Dictionary meaning of entropy pertaining to data is lack of order or predictability with data; In other words, data with the high disorder can be said to be data with high entropy, and, homogenous (or pure) data can be termed as data with very low entropy. Entropy can, thus, be defined as a measure of impurity of data. Higher the entropy, the higher impure the data is.
- Pure data segment or children node: As mentioned above, the value of entropy determines the purity of a data segment. The value of entropy close to zero represents the fact that data is pure. This essentially means that data belongs to one or mostly one class level (the class with a label). A value closer to 1 represents maximum disorder or maximum split. This implies 50-50 or equal splits in the data segment.
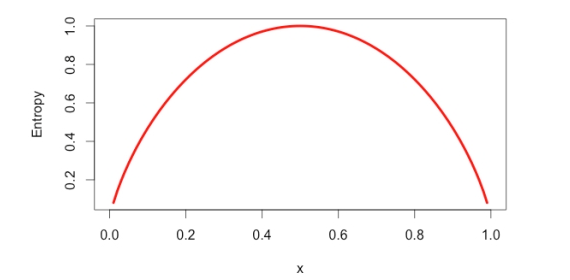
Figure 1. Entropy plot
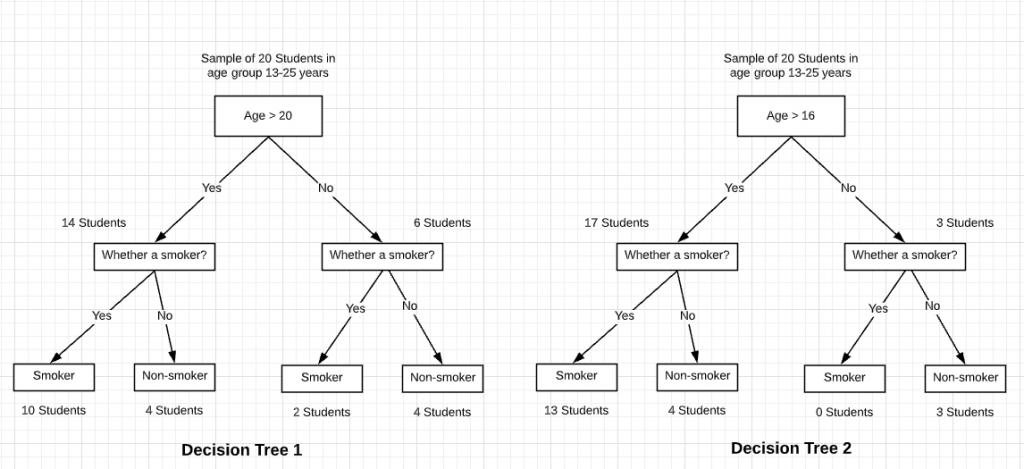
Let’s understand the concept of the pure data segment from the diagram below. In decision tree 2, you would note that the decision node (age > 16) results in the split of data segment which further results in creation of a pure data segment or homogenous node (students whose age is not greater than 16). The overall information gain in decision tree 2 looks to be greater than decision tree 1.
- How to calculate entropy value of a data segment: The value of entropy of a data segment can be calculated using summation on following formula for data segment with n classes with p representing proportion of value ((or probability of occurrence of a class) belonging to a particular class:
-p * log2 (p)
Thus, for data segment having data belonging to two classes A (say, head) and B (say, tail) where the proportion of value to class A (or probability p(A)) is 0.3 and for class B (p(B)) is 0.7, the entropy can be calculated as the following:
-(0.3)*log2 (0.3) - (0.7)*log2 (0.7)
= - (-0.5211) - (-0.3602)
= 0.8813
For data segment having split of 50-50, here is the value of entropy (expected value of 1).
-(0.5)*log2 (0.5) - (0.5)*log2 (0.5)
= - (0.5)*(-1) - (0.5)*(-1)
= 0.5 + 0.5
= 1
For data segment having split 90-10% (highly homogenous/pure data), the value of entropy is (expected value is closer to 0):
-(0.1)*log2 (0.1) - (0.9)*log2 (0.9)
= - (0.1)*(-3.3219) - (0.9)*(-0.1520)
= 0.3323 + 0.1368
= 0.4691
For completely pure data segment, the value of entropy is (expected value is 0):
-(1)*log2 (1) - (0)*log2 (0)
= - (1)*(0) - (0)*(infinity)
= 0
Based on the above calculation, one could figure out that the entropy varies as per the following plot:
- Information Gain: Information gain is the difference between the entropy of a data segment before the split and after the split. The high difference represents high information gain. Higher the difference implies the lower entropy of all data segments resulting from the split. Thus, the higher the difference, the higher the information gain, and better the feature used for the split. Mathematically, the information gain, I, can be represented as follows:
InfoGain = E(S1) - E(S2)
- E(S1) represents the entropy of data belonging to the node before split
- E(S2) represents the weighted summation of the entropy of children nodes; Weights equal to the proportion of data instance falling in specific children node.
Key Concepts – Decision Trees
- Decision tree topology: Decision tree consists of following different types of nodes:
- Root node: Top-most node of the tree from where the tree starts
- Decision nodes: One or more decision nodes that result in the splitting of data in multiple data segments. The goal is to have the children nodes with maximum homogeneity (purity).
- Leaf nodes: The node representing the data segment having the highest homogeneity (purity).
- A decision tree is built in the top-down fashion. Here is a sample decision tree whose details can be found in one of my other post, Decision tree classifier python code example. The tree is created using the Sklearn tree class and plot_tree method.
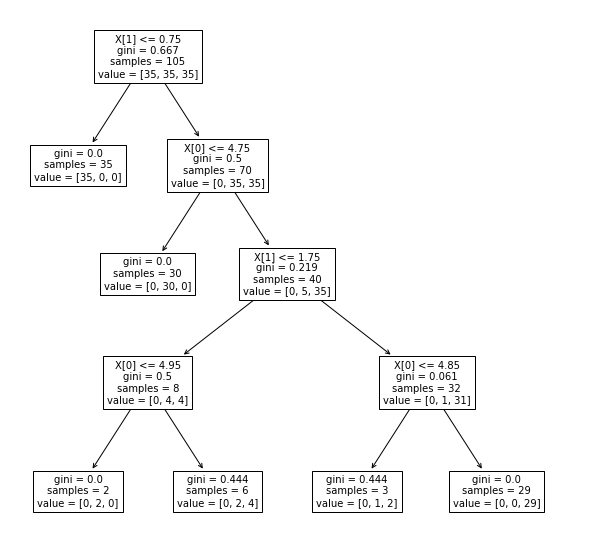
Fig 3. Decision Tree Visualization
- Decision Nodes represent Features/Attributes: Decision nodes represent the features/attributes based on which data is split into children nodes.
- Valid decision node or feature: A decision node or a feature can be considered to be suitable or valid when the data split results in children nodes having data with higher homogeneity or lower entropy (weighted entropy of children nodes added to determine overall entropy after the split).
A decision node or a feature can be considered to be suitable or valid when the data split results in children nodes having data with higher homogeneity or lower entropy
- The leaf node is reached when no significant information gain happens: A data segment is said to be pure if it contains data instances belonging to just one class and not the mix of class. For example, a segment of data consisting of only females can be said to be pure. However, a data segment consisting of 50-50 split can be said to be most impure or entropy of 1. Leaf nodes in the decision tree is reached when further splits do not result in any further information gain. This implies that resultant entropy of partitioned data segments remains almost equal to entropy before the split.
A data segment is said to be pure if it contains data instances belonging to just one class. The goal while building decision tree is to reach to a state where leaves (leaf nodes) attain pure state.
- Feature selection in decision trees: The goal of the feature selection while building a decision tree is to find features or attributes (decision nodes) which lead to split in children nodes whose combined entropy sums up to lower entropy than the entropy value of data segment before the split. This implies higher information gain.
The goal of the feature selection is to find the features or attributes which lead to split in children nodes whose combined entropy sums up to lower entropy than the entropy value of data segment before the split.
- Pre-pruning vs Post-pruning decision tree: Once you have understood feature selection technique in relation decision tree, you can end up creating a tree which results in leaf nodes having very high homogeneity (properly classified data). However, this may lead to overfitting scenario. Alternatively, if you have not done enough partitioning, there is a chance of underfitting. This aspect of stopping partitioning the tree early enough is also called as pre-pruning. The challenge is to find the optimal tree which results in the appropriate classification with acceptable accuracy. Alternatively, one can let the tree grow enough and then use error rates to appropriately prune the trees.
- Algorithm C5.0 is one of the most used implementations for building machine learning model based on the decision tree.
Decision Tree Classifier – Python Code Example
In this section, you will learn about how to train a decision tree classifier using Scikit-learn. The IRIS data set is used.
from sklearn.model_selection import train_test_split
from sklearn import datasets
from sklearn.tree import DecisionTreeClassifier
from sklearn import tree
#
# Load IRIS dataset
#
iris = datasets.load_iris()
X = iris.data
y = iris.target
#
# Create training and test data split
#
X_train, X_test, y_train, y_test = train_test_split(X, y, random_state=0)
#
# Create decision tree classifier
#
dt_clfr = DecisionTreeClassifier(max_leaf_nodes=3, random_state=0)
dt_clfr.fit(X_train, y_train)
Once the above code gets executed, you could as well draw the decision tree using
the following code in Google Colab notebook
from sklearn.tree import export_graphviz
import os
# Where to save the figures
PROJECT_ROOT_DIR = "."

def image_path(fig_id):
return os.path.join(PROJECT_ROOT_DIR, "sample_data", fig_id)

export_graphviz( dt_clfr,
out_file=image_path("iris_tree.dot"),
feature_names=iris.feature_names,
class_names=iris.target_names,
rounded=True,
filled=True )

from graphviz import Source
Source.from_file("./sample_data/iris_tree.dot")
Sample Interview Questions on Decision Tree
The following are some of the questions which can be asked in the interviews. The answers can be found in above text:
- What is entropy?
- What is information gain?
- How are entropy and information gain related vis-a-vis decision trees?
- How do you calculate the entropy of children nodes after the split based on on a feature?
- How do you decide a feature suitability when working with decision tree?
- Explain feature selection using information gain/entropy technique?
- Which algorithm (packaged) is used for building models based on the decision tree?
- What are some of the techniques to decide decision tree pruning?
Practice Test on Decision Trees Concept
[wp_quiz id=”6368″]
Summary
In this post, you learned about some of the following:
- Terminologies and concepts related to decision tree machine learning algorithm
- Sample interview questions
- Practice tests to check your knowledge
Did you find this article useful? Do you have any questions about this article or understanding decision tree algorithm and related concepts and terminologies? Leave a comment and ask your questions and I shall do my best to address your queries.
- The Watermelon Effect: When Green Metrics Lie - January 25, 2026
- Coefficient of Variation in Regression Modelling: Example - November 9, 2025
- Chunking Strategies for RAG with Examples - November 2, 2025


I found it very helpful. However the differences are not too understandable for me