
Paired sample t-tests are a commonly used statistical procedure used to compare two populations that are related in some way. They are often used for comparing dependent groups, such as the before and after results of an experiment. Data scientists must have a thorough understanding of the concept of paired sample t-test in order to craft accurate and reliable results when analyzing data. In this blog post, we will explore the formula, assumptions, and examples of paired sample t-tests.
What is Paired Sample T-Test and Why is it needed?
Paired sample t-tests are used to test whether means of same or similar group different from each other under separate conditions (before and after intervention). For example, you would want to test the efficacy of a drug on the same group of patients before and after drug is given to the patients. When the goal is to assess the effect of a particular treatment before and after, you can use paired sample t-tests. Here are some real-world examples where paired sample t-test can be used:
- Testing the effectiveness of a new advertising campaign compared to the existing one. Marketing teams will be interested in this analysis.
- Examining if there is an improvement in website performance with the introduction of a new feature. This will be very useful for product managers to evaluate impact of the new product features & functionality.
- Measuring the effectiveness of employee training programs by comparing pre and post test results.
- Evaluating the impact of new packaging design on consumer purchasing decisions.
- Comparing the average price of a product before and after a price change to measure the effect of the change on sales.
Here is going to be the null and alternate hypothesis for paired sample t-tests:
- Null Hypothesis: The mean of the difference of change variable between the two paired samples is zero (i.e. there is no statistically significant difference between them). In other words, the impact of treatment provided to group showed no significant difference from the earlier state.
- Alternate Hypothesis: The mean of the difference of variable between the two paired samples is not zero (i.e. there is a statistically significant difference between them). In other words, the impact of treatment provided to group showed significant difference from the earlier state.
T-Statistics Formula for Paired Sample T-Test
The following represents the formula for T-statistics:
T = (mean difference between pairs) / (standard deviation of differences / square root of sample size)
Where:
- Mean difference between pairs = (sum of differences between pairs) / sample size
- Standard deviation of differences = square root of [summation of variance of differences between pairs / (sample size – 1)]
Here is how the above would look like:
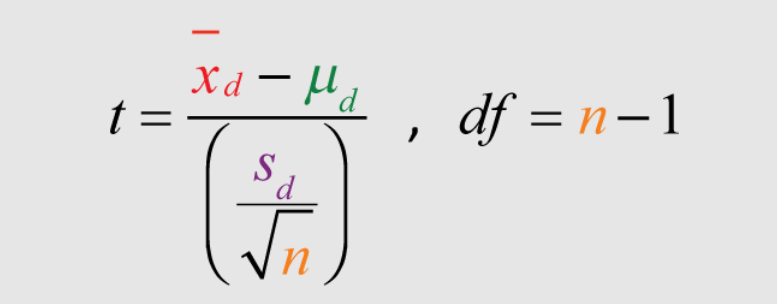
In the above formula, [latex]x_d[/latex] is the mean of difference in the change variable, [latex]s_d[/latex] is standard deviation of difference in change variable and n is the size of the sample.
Paired Sample T-Test Example
Based on the above formula, lets take a look at the example. Lets say the hypothesis is that walking for 1 hour a day for 3 months result in weight loss. In the example below, 10 people were subjected to the experiment and their weights (in KGs) were recorded after 3 months.
Null hypothesis is that the mean of difference between 10 pairs is zero. In other words, the change is weight is not significant.
Alternate hypothesis is that the mean of difference between 10 pairs is less than zero. In other words, the weights decrease after the walking is significant based on the evidence.
Here is the calculation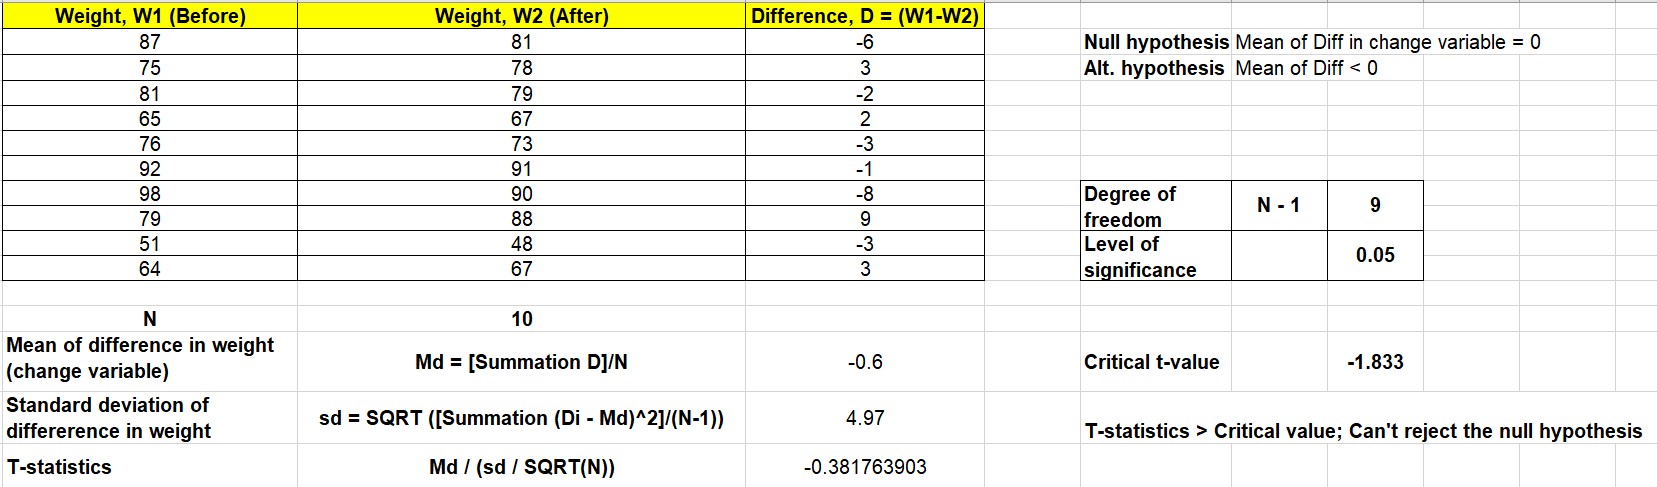
In the above test, the t-statistics is greater than critical t-value. In other words, it does not lie in the critical region. Thus, we don’t have enough evidence to reject the null hypothesis. So, based on the evidence, it can not be claimed that walking for 1 hours every day for 3 months would result in weight reduction.
Assumptions of Paired Sample T-Tests
Before conducting a paired sample t-test there are certain assumptions you must make about your data set.
- The observations within the two samples must be related or paired in a meaningful way. This means that each observation from one sample should correspond to an observation in the other sample, typically with a causal relationship between them. For example, if you are measuring customer satisfaction before and after implementing a new policy, the 2 samples consist of ratings given by same customers before and after implementation.
- All observations must be independent of each other. This means that no two pairs of observations should have any association with each other – they should all be measured independently and without any bias or underlying relationship between them.
- It is assumed that both the samples are normally distributed, with similar variance and mean. In other words, it is assumed that both sets of observations follow a bell curve shape when plotted on a graph, with both having roughly equal spread around the mean value.
- Both samples should have equal sample sizes. This ensures that all values within both samples have an equal opportunity to contribute to the final result and no one value has greater influence than another.
Conclusion
In conclusion, a paired sample t-test is an effective statistical test used to compare the means of two samples. It should be used whenever you wish to determine if there is a statistically significant difference between two related or paired groups. The assumptions for this type of analysis must be met in order to get reliable and accurate results. This includes observations within the two samples being related or paired in a meaningful way, all observations being independent of each other, data normally distributed with similar variances and means, and equal sample sizes. With these assumptions in mind, a paired sample t-test can provide reliable and accurate results.

Check out my books titled as Designing Decisions, and First Principles Thinking.
- The Watermelon Effect: When Green Metrics Lie - January 25, 2026
- Coefficient of Variation in Regression Modelling: Example - November 9, 2025
- Chunking Strategies for RAG with Examples - November 2, 2025

I found it very helpful. However the differences are not too understandable for me