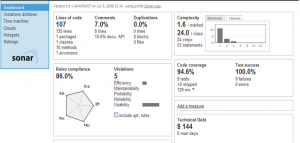
Following are three different aspects of software quality which could be tracked using Sonar Dashboard:
- Maintainability (testability, reusability & modularity)
- Usability (readability and understand-ability)
- Security
Following are different data elements that you could take from sonar dashboard and govern different aspects of software quality as mentioned below:
- Complexity vs Usability & Maintainability
- Rules Compliance Violations vs General Code Quality Practices & Security
- Duplication vs Maintainability
- LCOM4 vs Maintainability
- Test Coverage vs Maintainability
- Documentation vs Usability
Complexity vs Usability & Maintainability
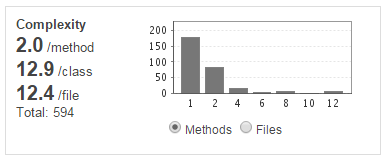
Complexity represents code complexity which, in turn, represents code cyclomatic complexity. Over a period of time, if complexity (of methods or class) increases, it depicts following:
- Code scores less in usability owing to increased number of decision points (if, for, while etc). Lesser usability implies that code is difficult to read and understand. And, this seems true owing to the fact that there are multiple ifs/whiles/fors in the code.
- Code scores less in maintainability owing to the fact that increased code complexity (and hence, increased decision points) impacts the code test-ability in the sense that it is difficult to achieve higher code coverage. As maintainability is directly proportional to test-ability, it could be inferred that higher code complexity tends to reduce the code maintainability.
Following diagram represents the code complexity in terms of cyclomatic complexity. In the following, code complexity per method is 2.0 and per class is 12.9. A code complexity of 10 or less is allowable for method or else, a code violation flag is raised.
Rules Compliance Violations vs General Code Quality Practices & Security
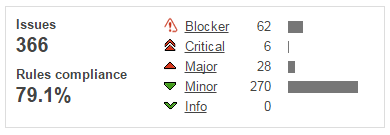
Sonar dashboard comes with rules compliance violations. One of the key things one could use this data is to watch out for security related violations. That said, one may want to use different security-related tool for this purpose. However, I have found it to be useful to watch out for security related coding violations as it serves the purpose sufficiently. From code quality perspective, it would be good to watch out for blocker and critical violations. It does come out with coding violations (against the configured code profile) developers ended up making with their code. Over a period of time, one could watch out for delta (changed) and report the team with frequently occuring violations. Following diagram represents the rules violations. Watch out for numbers related with blocker, critical, major, minor and info.
Duplication vs Maintainability
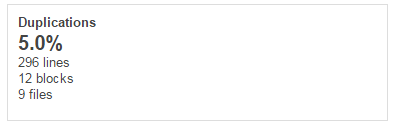
Duplication (represented in %) depicts the duplication of block of codes and files. It does impact the maintainability. Higher the duplication percentage, lower is the code maintainability. One should watch out for increase in code duplication and report to the team appropriately. Following diagram represents duplication in percentage.
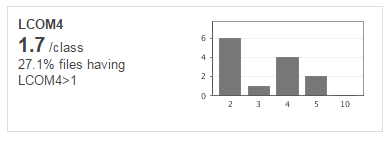
LCOM4 vs Maintainability
LCOM suspects are the files which has cohesion index (LCOM4) greater than 1. The value of LCOM4 is represnted in terms of number/class. For example, 2.5/class. This means that on an average, a class is doing 2.5 things. In simple words, these are files which violates single responsibility principle (SRP) which says that a class should do just one thing, or a class should have just one reason to change. Thus, higher percentage of files having LCOM4 > 1 impacts the maintainability in following ways:
- These files have lower reusability owing to lower cohesiveness.
- These files may have lower testability (owing to lower cohesiveness) as it may difficult to achieve high code coverage.
Thus, one should watch out for LCOM4. Following diagram represents the LCOM4 index. Following represents the fact that 27.1 % files have LCOM4 > 1 which implies that 27.1% files tends to violate single responsibility principle.
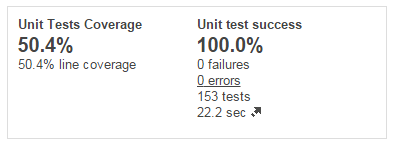
Test Coverage vs Maintainability
This is pretty straight forward. Test coverae is measured as unit test coverage. Higher the unit test coverage, higher the maintainability. One should watch out for ways unit test coverage changes and report to the team appropriately. Following diagram represents the unit test coverage.
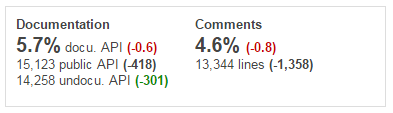
Documentation vs Usability
Very simple to understand, documentation is key component of making your code easy to understand, e.g., usability. It is denoted in percentage. Over a period of time, an increase in documentation would mean that code usability is increasing as code may be understood well with the help of documentation. Following diagram represents the documentation in percentage.

Check out my latest book titled as First Principles Thinking: Building winning products using first principles thinking.
- Three Approaches to Creating AI Agents: Code Examples - June 27, 2025
- What is Embodied AI? Explained with Examples - May 11, 2025
- Retrieval Augmented Generation (RAG) & LLM: Examples - February 15, 2025
I found it very helpful. However the differences are not too understandable for me