Quick code sample on how to concatenate the data frames columns. We will work with example of Boston dataset found with sklearn.datasets. One should note that data frames could be concatenated by rows and columns. In this post, you will learn about how to concatenate data frames by columns.
Here is the code for working with Boston datasets. First and foremost, the Boston dataset will be loaded.
from sklearn.datasets import load_boston
bd = load_boston()
Once loaded, let’s create different different data frames comprising of data and target variable.
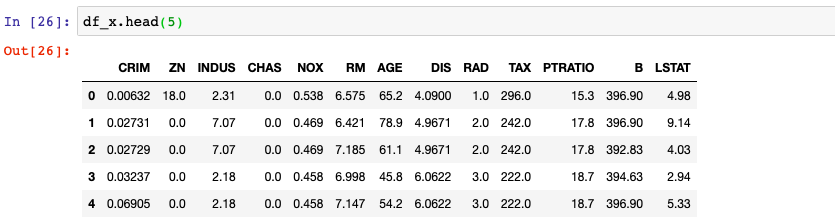
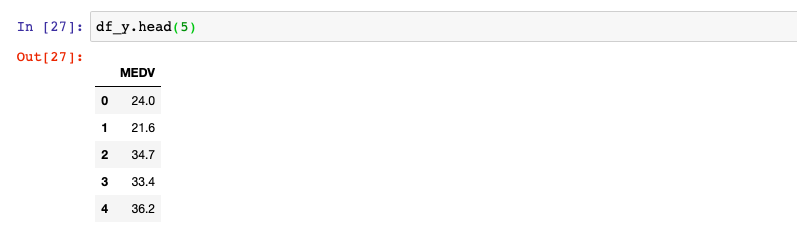
df_x = pd.DataFrame(data=bd.data, columns=bd.feature_names)
df_y = pd.DataFrame(data=bd.target, columns=["MEDV"])
This above creates two data frames comprising of data (features) and the values of target variable. Here are the snapshots.
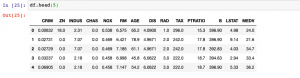
Use the following command to concatenate the data frames.
df = pd.concat([df_x, df_y], axis=1)
Here is the resulting data frame from concatenation of two data frames by columns.


Check out my latest book titled as First Principles Thinking: Building winning products using first principles thinking.
- Completion Model vs Chat Model: Python Examples - June 30, 2024
- LLM Hosting Strategy, Options & Cost: Examples - June 30, 2024
- Application Architecture for LLM Applications: Examples - June 25, 2024
Leave a Reply