
This article talks about 4 different quality parameters found on Sonar dashboard which could help measuring code maintainability. Following are those quality parameters:
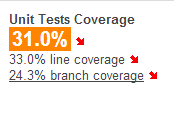
- Unit Test Coverage: Unit Test Coverage depicts code coverage in terms of unit tests written for the classes in the project.
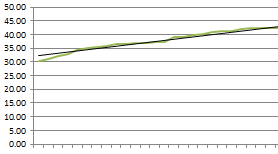
Greater test coverage depicts that developers are focusing on writing good unit tests for their code which results in greater test coverage. This also depicts the fact that the code is testable and hence, easier to change as a bad change could lead the unit tests to fail and raise the red flag. And, a code easier to change becomes a code easier to maintain. One another important thing to note is the fact that the focus should be given to capture the trending of test coverage over multiple releases to see if the test coverage is increasing or decreasing. For this purpose, one could use the “time machine” of the sonar. Following is a sample test coverage trendline which depicts the test coverage across severel releases.
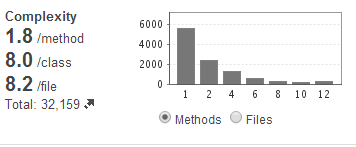
- Code Complexity: Code complexity is a measure of cyclomatic complexity and reflects the number of conditional expressions found in a particular class in the project.
Code complexity, in above diagram, depicts the conditional expressions present in the method and classes. A higher code complexity depicts that there are multiple conditional expressions in the class. This impacts the testability of the code (and hence code maintainability) as it becomes very difficult to write the unit tests having great coverage of such methods or classes. Additionally, it also impacts the read-ability and understandability of the code and hence code usability. Again, as mentioned in above point, it would be interesting to capture the trending of code complexity over multiple releases to check if the code complexity is increasing or decreasing.
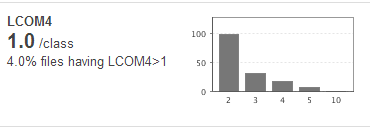
- LCOM4: LCOM4 stands for Lack of Cohesion of Methods. It reflects on the cohesiveness of a class. The ideal score of LCOM4 for a project could be 1 which represents that the all the classes in the project are cohesive. In other words, all classes in the project follow single responsibility principle. This, however, is very difficult to achieve in practical scenarios.
In above diagram, you would see that 4% of files have LCOM index greater than 1. This indicates the fact that 4% of files have code which is serving more than one responsibility and thus, could be difficult to change. In another words, 4% of files are less cohesive in nature and hence have lesser re-usability. From object oriented principles perspective, 4% of files violates the single responsibility principle. And, the files which violates the SRP could be seen as files that are difficult to change and hence, difficult to maintain.
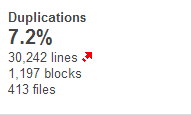
- Duplications: As the name implies, the duplication depicts the code duplications.
This is fairly simple to infer. Greater code duplication indicates that code is very difficult to maintain as one needs to update in multiple places if the functionality related with duplicated block of code changes.
[adsenseyu1]
- The Watermelon Effect: When Green Metrics Lie - January 25, 2026
- Coefficient of Variation in Regression Modelling: Example - November 9, 2025
- Chunking Strategies for RAG with Examples - November 2, 2025

Hi,
I like the way you summarized these metrics.
I would also add the cyclomatic dependencies as a good to check metric.
More than once I found out that we grouped packages the wrong way.
Regarding the complexity, I get annoyed by the fact that it counts the ‘equals’ method, which, if you generate it using eclipse, you get high complexity.
I haven’t deeply looked how to remove only ‘equals’ (and hashcode for that matter) in Sonar.
Woh I your posts, saved to fav!