This article represents code samples which could be used to create multiple density curve or plots using ggplot2 package in R programming language. Please feel free to comment/suggest if I missed to mention one or more important points. Also, sorry for the typos.
Multiple Density Curves/Graphs with GGPlot
The code samples given below works for “diamonds” dataset which is loaded as part of ggplot2 package. Following are two different types of plots shown below:
- Density plots with multiple fills
- Density plot with single fill
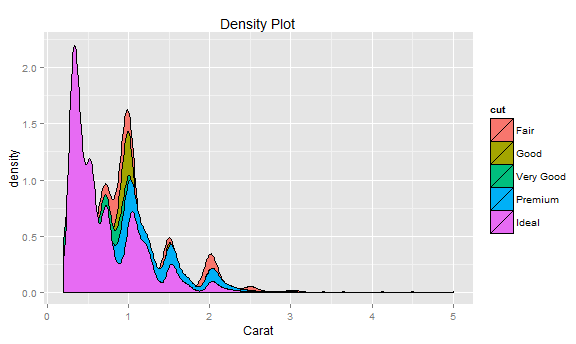
Density Plots with Multiple Fills:Following code represents density plots with multiple fills. Pay attention to the “fill” parameter passed to “aes” method.
# Create density plots for single variable filtered by fill condition
# In example below, fill is assigned to cut
ggplot(diamonds, aes(x=carat, fill=cut)) + geom_density() +
  labs(title="Density Plot", x="Carat")
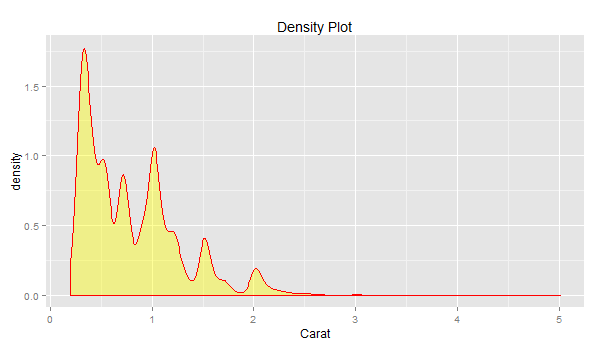
Density Plot with Single Fill: Following plot demonstrates the density plot with single fill.
# Create density plot for single variable
ggplot(diamonds, aes(x=carat)) + geom_density(col="red", fill="yellow", alpha=0.4) +
  labs(title="Density Plot", x="Carat")
Latest posts by Ajitesh Kumar (see all)
- The Watermelon Effect: When Green Metrics Lie - January 25, 2026
- Coefficient of Variation in Regression Modelling: Example - November 9, 2025
- Chunking Strategies for RAG with Examples - November 2, 2025


I found it very helpful. However the differences are not too understandable for me