In this post, you will learn about how to turn data into information and then to actionable insights with the help of few examples. It will be helpful for data analysts, data scientists, and business analysts to get a good understanding of what is actionable insight? You will understand aspects related to data-driven decision making.
Before getting into the details, let’s understand what is the problem at hand?
The school authority is trying to assess and improve the health of students. Here is the question it is dealing with:
How could we improve the overall health of the students in the school?
We will look into the approach of finding the solution to the above question using the data while understanding the concepts of actionable insights.
Data to Information to Insight
Let’s quickly understand the journey of data to become actionable insights.

In the above diagram, you may see how the data got transformed from being raw data to insights. Here is an explanation:
- Data: In the raw form, data can usually be found in the structured (database) or unstructured (documents) format. Usually, it makes it difficult to gather any knowledge from this data. Let’s take an example of a database table storing the weights of all students of a class along with their name and gender. One can go to each record and look for weight details. However, apart from providing weight detail, the data in this format does not tend to provide greater information.
- Data becomes information: In the next step, the data is acquired/derived/summarized in a suitable form and/or represented in a visual format for getting a better understanding. For example, one of the useful sets of information from weights data could be the mean, median, and mode of weights of students across different gender. Male students could have different mean weights while females could have different mean weights.
- Data becomes insights: In the final step, data becomes a good insight by setting a benchmark for the different age groups in males and females and finding out classes for which the mean weight is less than the benchmark. Based on this information or insight, the school authority may choose to take some action.
Data to Actionable Insights
Let’s learn about how could we turn data into actionable insights or how could we turn data to insights to action.
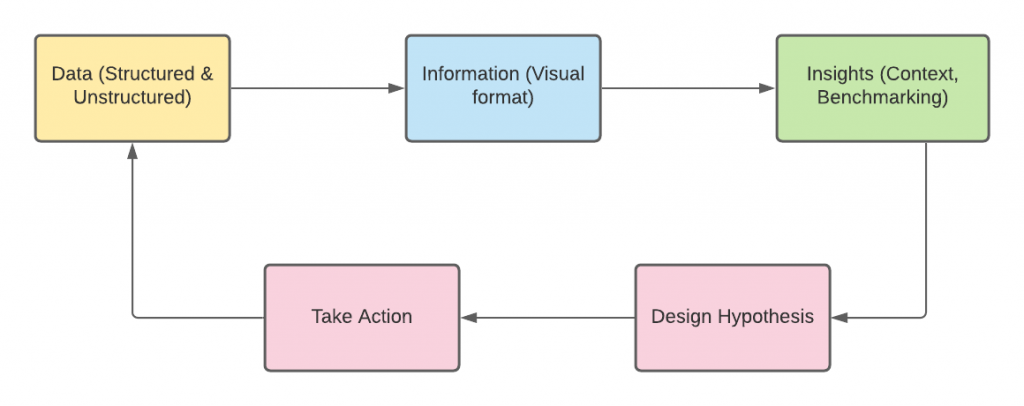
Here is the diagram representing how data could be transformed to action based on the insights gathered.

Let’s try and understand using the above example related to weights of students in the school vis-a-vis actionable insights.
The insight gathered from comparing mean weights of different age groups and classes against a benchmark resulted in finding out the classes and age group where the mean weights are less than or very near to the benchmark. These students could be termed underweight. This helps us in finding out students across different gender and classes where action need to be taken for improvement.
The next step is to design hypothesis around actions that could result in improving the weights of children. The following could be some hypothesis:
- Design appropriate physical training classes
- Conducting health test for such students to find deficiencies, if any
- Designing diet charts for such children with the help of dietician
- Informing parents to work on these children by sharing diet chart
- Tracking weights of such students on a regular basis (monthly)
Based on the above, action could be taken. All or some of the above actions could be taken. After the action is taken, the data is captured again, presented in a suitable format and insights studied to measure the effectiveness of the actions taken. This is how one could go from data to insights to action.
References
- Actionable insights – the missing link between the data and the business value
- What makes insights actionable?
- The Watermelon Effect: When Green Metrics Lie - January 25, 2026
- Coefficient of Variation in Regression Modelling: Example - November 9, 2025
- Chunking Strategies for RAG with Examples - November 2, 2025

I found it very helpful. However the differences are not too understandable for me