Well, if you are a software development partner for one or more of your customers, and you are looking forward for some of the following, you may want to adopt software quality metrics:
- Provide customers with software quality trending on various different software quality characteristic
- Monitor one or more projects for software quality
What are various different things that you could measure for quantifying software quality?
- Defects Density (Functional Suitability): There are different data points you can use to measure defects density. Defects density can be defined to be one of the following:
- Number of defects divided by total lines of code written per sprint/release
- Number of defects divided by total size of sprints while working based on Agile methodology
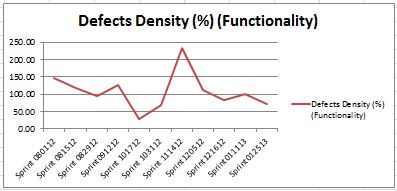
Defects density can also be used to represent how consistently a functionality is delivered. You may want to make a point that functional suitability is one of the key software quality characteristics. Following is how could you measure the defects density:
- Gather the number of defects from defect tracking system
- Gather the lines of code using various different tools such as Sonar; Gather the size of sprint from agile tool.
- Calculate the defect density based upon above formula.
Following represents a diagram on what would it look like over different sprints:
How do you read above?
Spikes represents the fact there were to many defects in one of the sprint. You may go and ask the team/scrum master and understand the reason behind the spike. Some of the reason may be complexity of the stories in the sprint, or, stories requiring the integration etc.
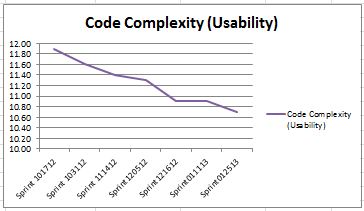
- Code Complexity (Usability): If you want to have your code easy to read and understand, you may want to measure the McCabe code complexity in terms of cyclomatic complexity. Higher the code complexity, difficult is the understandability and readability of the code and hence, lower the code usability and vice-verse.One can get the code complexity data using tools such as Sonar.Following represents a diagram on what would code usability look like over different sprints:
- Unit Test Coverage (Testability): Unit test coverage represents the testability aspect of the code. Testability is a key characteristic of Maintainability and represents how easy is to test the code. Ease of testability also represents ease of changeability and hence high maintainability. Unit test coverage can be found using various different code coverage tool such as Cobertura etc.Following represents a diagram on what would testability look like over different sprints:
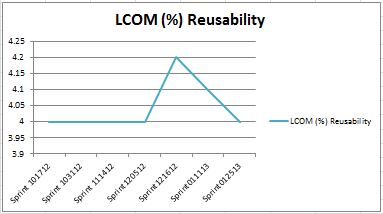
- LCOM Suspect (Re-usability): LCOM stands for Lack of Cohesion of Method. I came across this metric from tool called as Sonar. LCOM suspect represents percentage of classes which is suspected to serve multiple functionality and are thus, low in cohesion. And, lower the cohesion, lower the reusability.Following represents a diagram on what would LCOM Suspect look like over different sprints:
- The Watermelon Effect: When Green Metrics Lie - January 25, 2026
- Coefficient of Variation in Regression Modelling: Example - November 9, 2025
- Chunking Strategies for RAG with Examples - November 2, 2025


I found it very helpful. However the differences are not too understandable for me