Last updated: 18th Dec, 2023
When it comes to statistical tests, z-test and t-test are two of the most commonly used. But what is the difference between z-test and t-test? And when to use z-test vs t-test? In this relation, we also wonder about z-statistics vs t-statistics. And, the question arises around what’s the difference between z-statistics and t-statistics. In this blog post, we will answer all these questions and more! We will start by explaining the difference between z-test and t-test in terms of their formulas. Then we will go over some examples so that you can see how each test is used in practice. As data scientists, it is important to understand the difference between z-test and t-test so that you can choose the right test for your data. Let’s get started!
Check out this Z-test vs T-test decision tool which will help you select the most appropriate test out of Z-test and T-test based on your input.
Z-test is a statistical hypothesis testing technique which is used to test the null hypothesis in relation to the following given that the population’s standard deviation is known and the data belongs to normal distribution:
Z-test can be used to test the hypothesis that there is a difference between sample and population. In other words, test whether the difference between sample and population is statistically significant. This hypothesis can be tested using one-sample Z-test for means. In other words, one-sample Z-test for means can be used to test the hypothesis that the sample belongs to the population. In this test, the mean of the sample is compared against the population mean in the sampling distribution.
For example, suppose a researcher wants to investigate if the average height of students in a particular university differs from the average height of college students across the country. They could collect a random sample of students from the university and calculate the mean height of the sample. They can then conduct a Z-test to determine if the difference between the sample mean and the population mean is statistically significant or not.
The formula for Z-statistics for one-sample Z-test for means is given below. The standard error in the formula given below is the standard deviation of the sampling distribution of the mean which is the distribution of all possible sample means that could be obtained from the population. Read greater details in this blog, one-sample Z-test for means. The z-statistic measures how many standard deviations the sample mean is from the population mean. It is used to determine the statistical significance of the difference between the sample mean and the population mean.
Z = (X̄ – µ)/SE
= (X̄ – µ)/σ/√n, , where SE is the standard error, X̄ is the sample mean, µ is the population mean, σ is the population standard deviation and the n is the sample size.
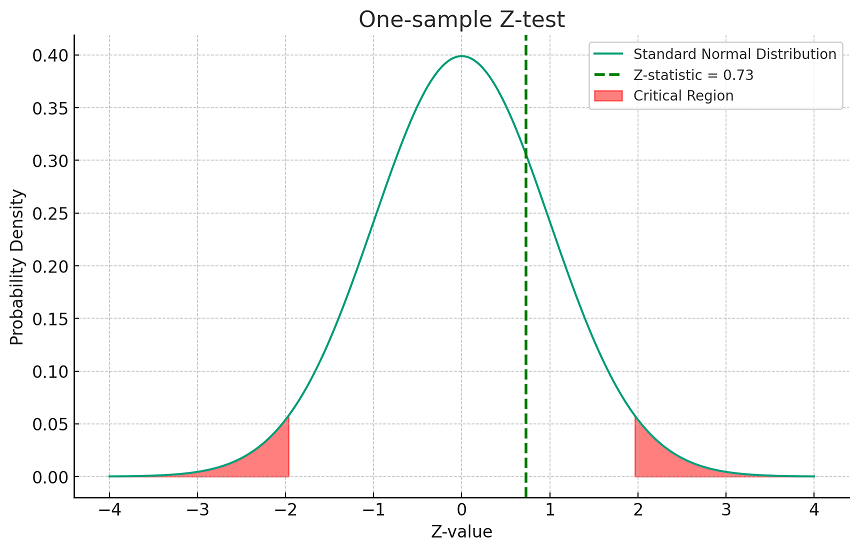
The diagram below represents z-statistics for a sample data. The plot above represents a one-sample z-test with the following characteristics:
Since the z-statistic is within the critical values (i.e., it is less than 1.96 and greater than -1.96), we would not reject the null hypothesis based on this z-statistic at the 0.05 significance level.
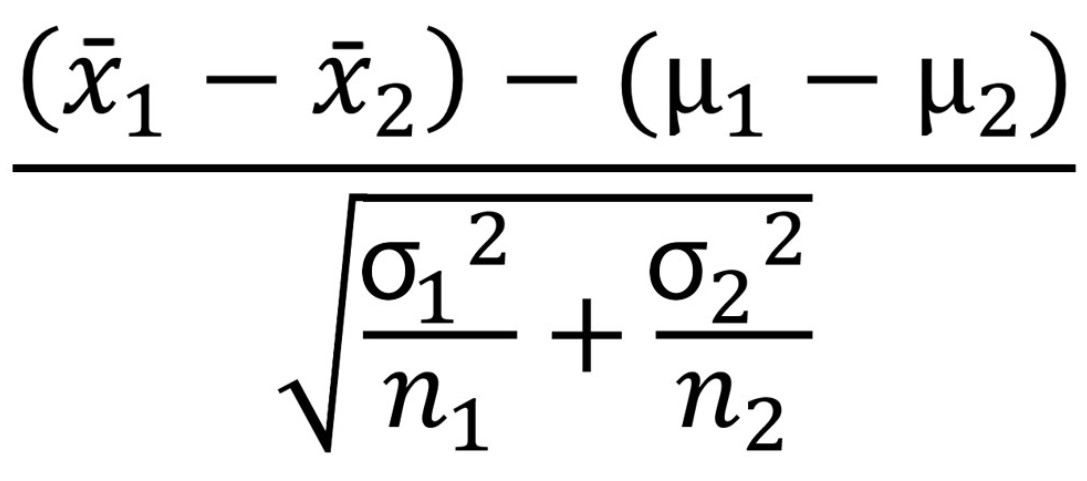
Z-test can be used to test the hypothesis that there is difference between the two independent sample means. In other words, test whether the difference between the two independent samples is statistically significant. This hypothesis can be tested using two-sample Z-test for means. A two-sample z-test for means is a statistical test used to compare the means of two independent samples. The null hypothesis for a two-sample z-test for means states that there is no significant difference between the means of the two samples. The formula for Z-statistics is the following. Read further details in this blog, Two-sample Z-test for means.
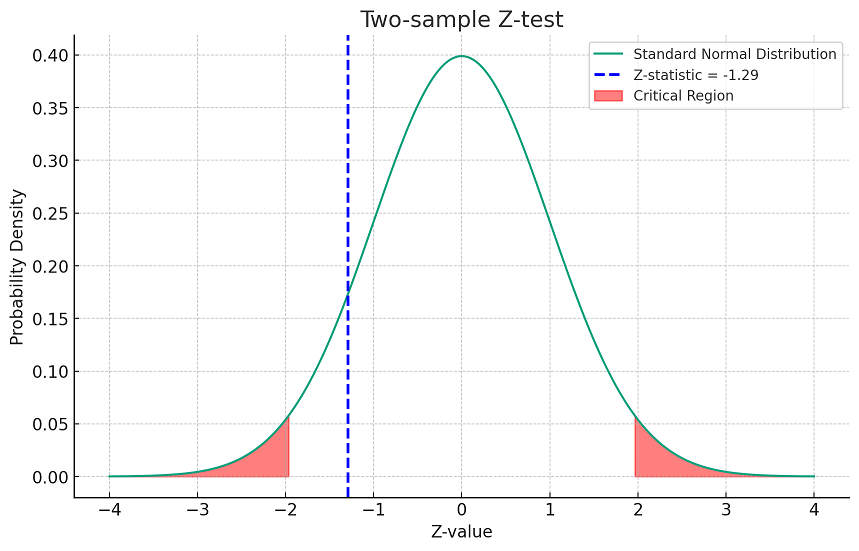
The following represents plot for a two-sample z-test, assuming some hypothetical values for these parameters, and show the critical region where the null hypothesis would be rejected. We will use a significance level of 0.05 for a two-tailed test.
The plot illustrates a two-sample z-test with the following details:
Given this z-statistic, we would not reject the null hypothesis since the z-statistic falls outside the critical regions (it is not less than -1.96 or greater than 1.96).
Z-test can be used to test hypothesis related to proportions as well.
T-test is a statistical hypothesis technique which is used to test the null hypothesis in relation to the following given the population standard deviation is unknown, data belongs to normal distribution, and the sample size is small (size less than 30)
There is no difference between the sample mean and the population mean given the population standard deviation is known and the sample size is small, or, the population standard deviation is unknown. This is very much similar to one-sample Z-test for means. Greater details can be read in this blog, one-sample t-test for means. The formula for t-statistics look like the following. Note that the sample mean is compared with the population mean as like in one sample Z-test. However, the difference lies in how the standard error is calculated as the ratio of standard deviation of the sample and the square root of the sample size.
T = (X̄ – μ) / SE
= (X̄ – μ) / S/√n, where SE is the standard error, X̄ is the sample mean, µ is the population mean, S is the sample standard deviation and the n is the sample size. Note the difference between the Z-statistics and T-statistics in one-sample Z-test and one-sample T-test in relation to usage of population standard deviation σ in case of Z-test while sample standard deviation, S in case of T-test.
There is no difference between the two samples given the population standard deviation is known and the sample size is small, or, the population standard deviation is unknown. This hypothesis can be tested using two-samples t-test for independent samples. In case of two-samples t-test for independent samples, different formula exists in case the variance of the two populations are equal or otherwise. In case the population variances are unequal, the pooled variance is used to calculate the T-statistics. Read further details about two-sample t-test for independent samples in this blog, two-samples t-test for independent samples: formula and examples. Note the difference between the formula for two-samples Z-test for means and the two-samples t-test for means in the respective blogs. The formula for two-samples t-test for independent samples given population variances are equal is the following:
The following represents the differences between Z-Test and T-Test:
| Feature | Z-test | T-test |
|---|---|---|
| Definition | A Z-test is a statistical test used to determine whether two population means are different when the variances are known and the sample size is large. | A T-test is a statistical test used to determine if there is a significant difference between the means of two groups, which may be related in certain features. |
| Sample Size | Typically used for larger sample sizes, usually over 30. | Often used for smaller sample sizes, less than 30. |
| Population Variance | Known | Unknown |
| Distribution | Normal distribution | T-distribution, which varies depending on the degrees of freedom. |
| Use Case | Used when data is normally distributed and the sample size is large. | Used when the data is not normally distributed or when the sample size is small, making the standard deviation less reliable. |
| Types | One-sample Z-test, Two-sample Z-test. | One-sample T-test, Two-sample T-test, Paired T-test. |
| Standard Error | Uses population standard deviation. | Uses sample standard deviation. |
| Applicability | More suited for hypothesis testing with large sample sizes and known population variances. | More versatile, can be used for both small and large sample sizes with unknown population variances. |
| Statistics | In Z-test, z-statistics is used | In T-test, t-statistics is used. |
| Confidence intervals | Confidence intervals for large samples can be constructed using Z-scores, which are more precise with larger data. | T-distribution provides a more accurate confidence interval for smaller samples, important in cases like cross-validation where sample sizes are limited. |
| Assumptions | Assumes data is approximately normally distributed when sample size is large. | Less dependent on the normality assumption, especially useful when the data distribution is unknown or non-normal. |
The following decision flow can be used to arrive at decision regarding whether to use Z-test vs T-test:
The above assumes that other conditions for the tests (like the independence of observations) are met and that nonparametric tests are considered when the distribution assumptions are not satisfied.
Understanding when to use a Z-test versus a T-test in statistical analysis is crucial for accurate results. Here are some examples:
The following are some of the most common FAQs when dealing with T-test and Z-test:
The z-test and t-test are different statistical hypothesis tests that help determine whether there is a difference between two population means or proportions. The z-statistic is used to test for the null hypothesis in relation to whether there is a difference between the populations means or proportions given the population standard deviation is known, data belongs to normal distribution, and sample size is larger enough (greater than 30). T-tests are used when the population standard deviation is unknown, the data belongs to normal distribution and the sample size is small (lesser than 30).
Last updated: 12th May 2024 In this blog, we get an overview of the machine…
Last updated: 12th May, 2024 In the world of generative AI models, autoencoders (AE) and…
Last updated: 7th May, 2024 Linear regression is a popular statistical method used to model…
Last updated: 3rd May, 2024 Have you ever wondered why some machine learning models perform…
Last updated: 2nd May, 2024 The success of machine learning models often depends on the…
When working on a machine learning project, one of the key challenges faced by data…
View Comments
Hello M. Ajitesh Kumar,
In this blog, below the diagram there is an error in the explanation,
Please see this sentence: If the population standard deviation is unknown, Z-test is recommended to be used.
Thank you for pointing that out. Corrected.
Great job!
Thanks for explaining clearly!