Boxplot for deciding whether to use mean, mode or median for imputation
Last updated: 18th Dec, 2023
Have you found yourself asking question such as how to deal with missing values in data analysis stage? When working with Python, have you been troubled with question such as how to replace missing values in Pandas data frame?
Well, missing values are common in dealing with real-world problems when the data is aggregated over long time stretches from disparate sources, and reliable machine learning modeling demands for careful handling of missing data. One strategy is imputing the missing values, and a wide variety of algorithms exist spanning simple interpolation (mean, median, mode), matrix factorization methods like SVD, statistical models like Kalman filters, and deep learning methods. Missing value imputation or replacing techniques help machine learning models learn from incomplete data. There are three main missing value imputation techniques – replace missing values with mean, median and mode.
In this blog post, you will learn about some of the following:
The dataset used for illustration purpose is related campus recruitment and taken from Kaggle page on Campus Recruitment. As a first step, the data set is loaded. Here is the python code for loading the dataset once you downloaded it on your system.
import pandas as pd
import numpy as np
df = pd.read_csv("/Users/ajitesh/Downloads/Placement_Data_Full_Class.csv")
df.head()
Here is what the data looks like. Make a note of NaN values under the salary column. We will learn about how to replace NaN values with mean, median and mode in Pandas dataframe.
Missing values are handled using different interpolation techniques which estimate the missing values from the other training examples. In the above dataset, the missing values are found in the salary column. The command such as df.isnull().sum() prints the column with missing value. The missing values in the salary column in the above example can be replaced using the following techniques:
In this post, fillna() method on the data frame is used for imputing missing values with mean, median, mode or constant value. However, you may also want to check out the related post titled imputing missing data using Sklearn SimpleImputer wherein sklearn.impute.SimpleImputer is used for missing values imputation using mean, median, mode, or constant value. The SimpleImputer class provides basic strategies for imputing missing values. Missing values can be imputed with a provided constant value, or using the statistics (mean, median, or most frequent) of each column in which the missing values are located. You may also want to check out the Scikit-learn article – Imputation of missing values.
The mean, median, and mode are fundamental measures of central tendency in statistics, each providing a different perspective on the “central” value of a set of data. The mean, often referred to as the average, is calculated by summing all the values in a dataset and dividing by the number of values. It’s a useful measure for understanding the overall level of a dataset, but it can be heavily influenced by outliers or extremely high or low values.
The median, on the other hand, is the middle value of a dataset when it is ordered from lowest to highest. If there is an even number of values, the median is the average of the two middle values. Unlike the mean, the median is not affected by outliers, making it a more reliable measure for skewed distributions.
Lastly, the mode is the most frequently occurring value in a dataset. There can be more than one mode in a set of data if multiple values occur with the same highest frequency. The mode is particularly useful for categorical data where we want to know which is the most common category.
Each of these measures gives a unique insight into the data, and understanding their differences is key to correctly interpreting data in various fields, from business and economics to science and engineering.
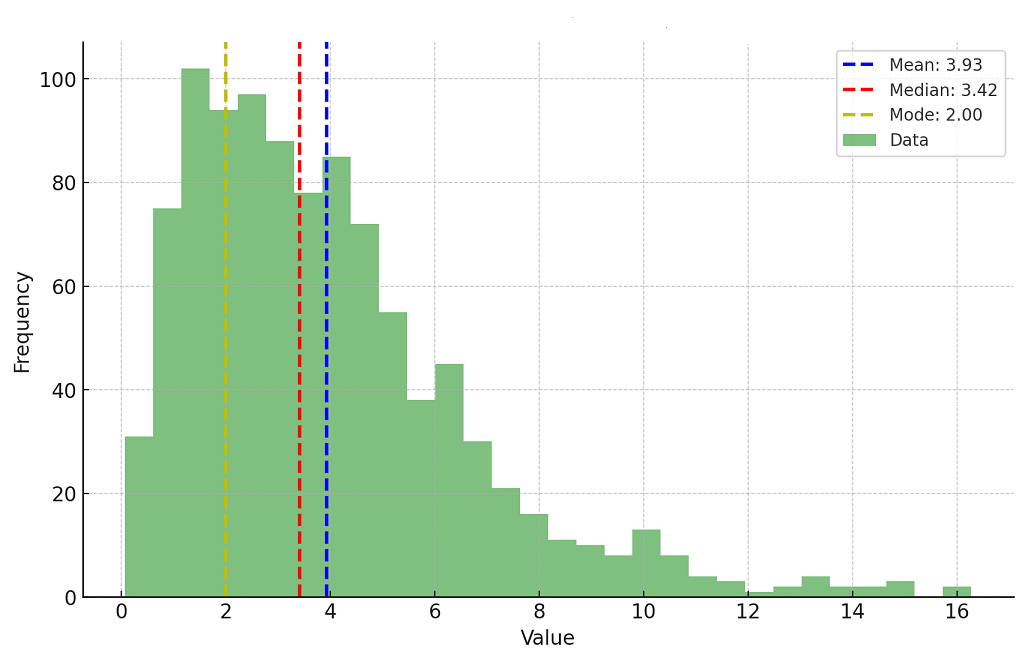
The following plot represents mean, median and mode for positively skewed dataset.
The following represents mean, median and mode for negatively skewed dataset.
One of the key points is to decide which imputation techniques to use for filling missing values with mean, median or mode. In this post, the central tendency measures such as mean, median, or mode is considered for imputation. The goal is to find out which is a better measure of the central tendency of data and use that value for filling missing values appropriately.
Plots such as box plots and density plots come very handily in deciding which imputation techniques to use. You can use the following code to print different plots such as box and distribution plots.
import seaborn as sns
#
# Box plot
#
sns.boxplot(df.salary)
#
# Distribution plot
#
sns.distplot(df.salary)
Here is what the box plot would look like. You may note that the data is skewed. There are several or large numbers of data points that act as outliers. Outliers data points will have a significant impact on the mean and hence, in such cases, it is not recommended to use the mean for replacing the missing values. Using mean values for replacing missing values may not create a great model and hence gets ruled out. For symmetric data distribution, one can use the mean value for imputing missing values.
Thus, one may want to use either median or mode. Here is a great page on understanding boxplots.
You can also observe a similar pattern from the plotting density plot. One can observe that there are several high-income individuals in the data points. The data looks to be right-skewed (long tail in the right). Here is how the plot looks like.
The most simple technique of all is to replace missing data with some constant value. The value can be any number that seemed appropriate.
It is important to keep in mind that imputing missing values with summary statistics like mean, median, or mode can introduce bias in the data, as it assumes that the missing values are similar to the non-missing values. Additionally, the choice of imputation method can also affect the performance of the machine learning model, as it can impact the relationships between variables in the dataset.
The following can be seen as standard guideline for using mean, median or mode for replacing the missing values:
It is recommended that we evaluate the impact of different imputation strategies on the performance of the machine learning model using cross-validation techniques, and select the method that yields the best results. If the missing values are a significant proportion of the data, it may be better to consider more advanced imputation methods, such as using regression models or machine learning algorithms to predict the missing values.
One of the techniques is mean imputation in which the missing values are replaced with the mean value of the entire feature column. In the case of fields like salary, the data may be skewed as shown in the previous section. In such cases, it may not be a good idea to use mean imputation for replacing the missing values. Note that imputing missing data with mean values can only be done with numerical data.
The following is the python code that demonstrates usage of fillna with mean value for filling missing values in pandas dataframe with mean.
df.fillna(df.mean())
Another technique is median imputation in which the missing values are replaced with the median value of the entire feature column. When the data is skewed, it is good to consider using the median value for replacing the missing values. Note that imputing missing data with median value can only be done with numerical data.
Here is the python code that demonstrates usage of fillna with median value for filling missing values in pandas dataframe with median. Recall that fillna() method fill nan with mean value.
df.fillna(df.median())
Yet another technique is mode imputation in which the missing values are replaced with the mode value or most frequent value of the entire feature column. When the data is skewed, it is good to consider using mode values for replacing the missing values. For data points such as the salary field, you may consider using mode for replacing the values. Note that imputing missing data with mode values can be done with numerical and categorical data.
Here is the python code that demonstrates usage of fillna with mode for replacing missing values in pandas dataframe with mode:
df['salary'] = df['salary'].fillna(df['salary'].mode()[0])
Here is how the data frame would look like (df.head())after replacing missing values of the salary column with the mode value. Note the value of 30000 in the fourth row under the salary column. 30000 is the mode of salary column which can be found by executing commands such as df.salary.mode()
You may want to check other two related posts on handling missing data:
Take a quick quiz to check your understanding of concepts related with imputing missing values with mean, median or mode.
The following are some of the most commonly asked questions when working with missing values imputation in Pandas dataframe in Python. In the answers below, df stands for Pandas dataframe in which data is stored.
Calculate mean, median and mode
In this post, you learned about some of the following:
Last updated: 15th May, 2024 Have you ever wondered how your bank decides what to…
In this fast-changing world, the ability to learn effectively is more valuable than ever. Whether…
Last updated: 13th May, 2024 Whether you are a researcher, data analyst, or data scientist,…
Last updated: 12th May, 2024 Data lakehouses are a relatively new concept in the data…
Last updated: 12th May 2024 In this blog, we get an overview of the machine…
Last updated: 12th May, 2024 In the world of generative AI models, autoencoders (AE) and…
View Comments
Totally enjoyed reading this article, and i learnt a lot. Thanks a lot and i look forward to reading more of your articles.
The dataset used is not quite the best to showcase this as Nal in
the salary column is actually representative of a candidate not
getting placed rather than missing data. There is actually no need
to replace the NaN values here imo.
Thanks Sanidhya. I will review this.