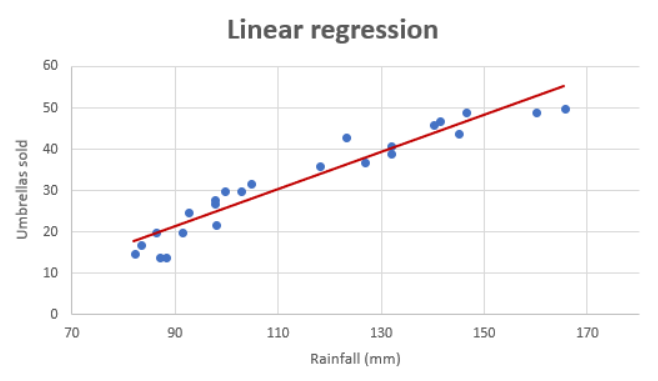
If you want to build a model for predicting a numerical value and wondering whether the linear regression model is most appropriate or valid, then creating the regression scatter plot is the most efficient way. And, this works best if the data set is two or three-dimensional. If a dataset is two-dimensional, it’s simple enough to plot the data to determine its shape. You can plot three-dimensional data too. The objective is to find whether the data set is relatively linear. When the plot is created, the data points fall roughly along a straight line as shown below.
The challenge comes when we come across multi-dimensional datasets. This resembles the real-world scenario. How do we determine whether the linear regression model can be the most appropriate model for a regression problem? The challenge happens because it is not possible to create a linear scatter plot to the assess data linear relationship for a dataset which is having more than three dimensions.
To determine whether a high-dimensional dataset might be suitable for linear regression, one effective approach is to reduce the dimensionality of the dataset to two or three dimensions and then visualize the results. This can be achieved using techniques like Principal Component Analysis (PCA) and t-distributed Stochastic Neighbor Embedding (t-SNE). Both reduce the dimensionality of a dataset without incurring much loss of information. With PCA, for example, it is found to reduce the number of dimensions by 90% while retaining 90% of the information in the original dataset.
The following is a high-level summary of above-mentioned techniques for dimensionality reduction:
Principal Component Analysis (PCA):
t-distributed Stochastic Neighbor Embedding (t-SNE):
This is how the dimensionality reduction technique helps in deciding appropriateness of linear regression model for high-dimensional datasets:
The process of dimensionality reduction might seem like it magically simplifies data, but it is grounded in mathematical principles. PCA, for example, relies on eigenvalue decomposition or singular value decomposition to find the directions (principal components) that capture the most variance in the data. This is why PCA can significantly reduce dimensions while retaining most of the information.
We’ve all been in that meeting. The dashboard on the boardroom screen is a sea…
When building a regression model or performing regression analysis to predict a target variable, understanding…
If you've built a "Naive" RAG pipeline, you've probably hit a wall. You've indexed your…
If you're starting with large language models, you must have heard of RAG (Retrieval-Augmented Generation).…
If you've spent any time with Python, you've likely heard the term "Pythonic." It refers…
Large language models (LLMs) have fundamentally transformed our digital landscape, powering everything from chatbots and…