Pandas is a library for data analysis in Python. It offers a wide range of features, including working with missing data, handling time series data, and reading and writing data in different formats. Pandas also provides an efficient way to manipulate and calculate data. One of its key features is the Pandas DataFrame, which is a two-dimensional array with labeled rows and columns. A DataFrame is a table-like structure that contains columns and rows of data. Creating a Pandas DataFrame from a NumPy array is simple. In this post, you will get a code sample for creating a Pandas Dataframe using a Numpy array with Python programming.
import numpy as np
import pandas as pd
arr = np.array([[4, 7], [15,18],
                [18,21], [13,19],
                [10,15], [7,12],
                [4,6], [5,9], [8,10], [9,14], [13,15], [11,12], [12,17]])
This is how the array would look like:
array([[ 4,  7],
       [15, 18],
       [18, 21],
       [13, 19],
       [10, 15],
       [ 7, 12],
       [ 4,  6],
       [ 5,  9],
       [ 8, 10],
       [ 9, 14],
       [13, 15],
       [11, 12],
       [12, 17]])
Transposing a numpy array simply means that the axes have been switched. The shape of the array is still the same, just the orientation has changed. To transpose a numpy array, you use the transpose() method. For example, if you have an array named “arr”, you can transpose it by typing “arr.transpose()”. Transposing a 2-dimensional array will switch the rows and columns.
arr_tp = arr.transpose()
This is how the transpose would look like:
array([[ 4, 15, 18, 13, 10,  7,  4,  5,  8,  9, 13, 11, 12],
       [ 7, 18, 21, 19, 15, 12,  6,  9, 10, 14, 15, 12, 17]])
df = pd.DataFrame({'col1': arr_tp[0], 'col2': arr_tp[1]})
Print the data using head command such as df.head(). This is how the data frame would look like:
      col1 col2
0 4 7
1 15 18
2 18 21
3 13 19
4 10 15
In case, you would like to quickly plot the data and look for relationship, here are the command using seaborn package:
import seaborn as sns
sns.scatterplot(x=df['col1'], y=df['col2'])
The above would print the following plot:
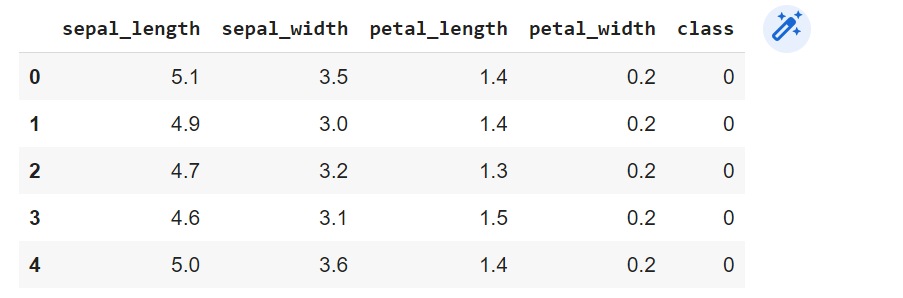
Based on the steps described in the blog post, the code below represents how could you create dataframe from the array data. The dataset is IRIS dataset. Note that the column and row labels are specified when creating the DataFrame, which can be helpful for referencing specific data later on.
import pandas as pd
from sklearn import datasets
#
# Load the IRIS dataset
#
iris = datasets.load_iris()
#
# Transpose of numpy array
#
iris_tp = iris.data.transpose()
#
# Creating dataframe from transposed array
#
df = pd.DataFrame({"sepal_length":iris_tp[0],
                   "sepal_width":iris_tp[1],
                   "petal_length":iris_tp[2],
                   "petal_width":iris_tp[3]})
#
# Adding target or class
#
df["class"] = iris.target
#
# Print and check
#
df.head()
The following dataframe gets printed.
In this blog, you would get to know the essential mathematical topics you need to…
This blog represents a list of questions you can ask when thinking like a product…
AI agents are autonomous systems combining three core components: a reasoning engine (powered by LLM),…
Artificial Intelligence (AI) has evolved significantly, from its early days of symbolic reasoning to the…
Last updated: 25th Jan, 2025 Have you ever wondered how to seamlessly integrate the vast…
Hey there! As I venture into building agentic MEAN apps with LangChain.js, I wanted to…