Linear regression and correlation are fundamental concepts in statistics, often used in data analysis to understand the relationship between two variables. Linear regression and correlation, while related, are not the same. They serve different purposes and provide different types of information. In this blog, we will explore each concept with examples to clarify their differences and applications.
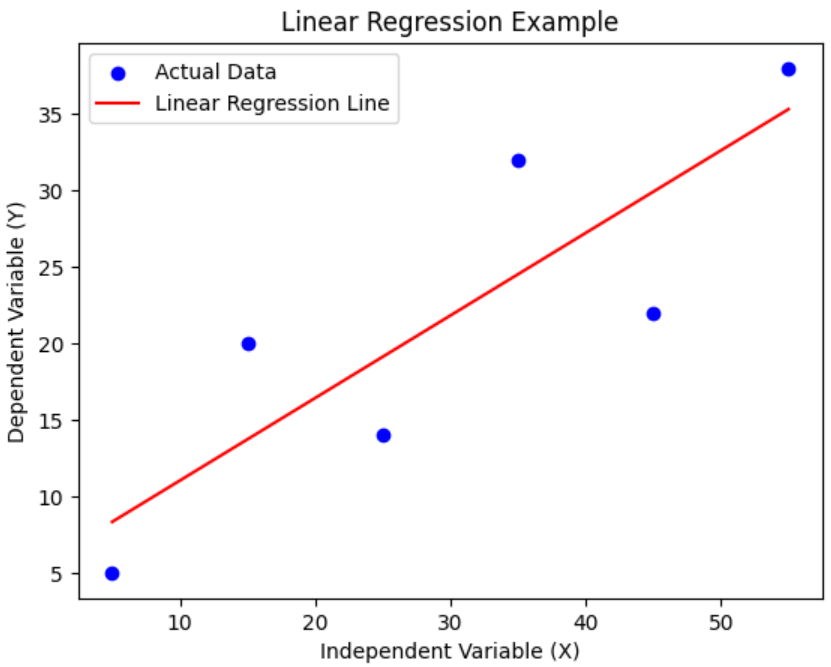
Linear Regression is a statistical method used for modeling the relationship between a dependent variable and one or more independent variables. The core idea is to find a linear equation that best describes this relationship, enabling the prediction of the dependent variable based on the values of the independent variables. The model that is used to make the prediction is called as linear regression model. The following is the example of linear regression model, the output of which is represented as linear regression line. Learn more about this concept from this page: Linear Regression Explained with Real-life Examples.
Correlation, in statistics, is a measure that indicates the extent to which two or more variables fluctuate together. It provides a single number, the correlation coefficient, which quantifies the strength and direction of a linear relationship between two variables. The most commonly used correlation coefficient is Pearson’s correlation coefficient, denoted as r, which ranges from -1 to +1. The value, r =1, is a perfect positive linear correlation, meaning as one variable increases, the other variable increases at a constant rate. The value, r = -1, is a perfect negative linear correlation, indicating that as one variable increases, the other decreases at a constant rate. The value, r = 0, represents no linear correlation; the variables do not have a linear relationship. Check out this blog – Pearson Correlation Coefficient: Formula, Examples. Another popular correlation coefficient is Spearman Correlation Coefficient.
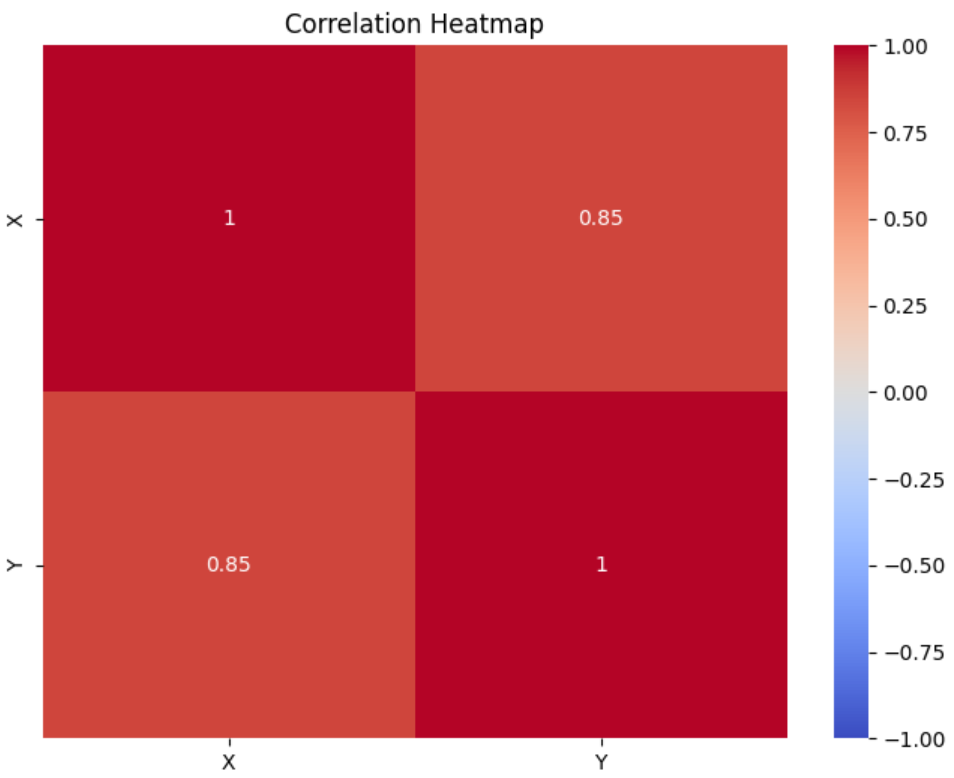
The following is correlation heatmap which is used to visualize the correlation matrix. The correlation matrix shows the correlation coefficients between each pair of variables. The heatmap is annotated with the correlation coefficients and uses a color scale to represent the strength of the correlation. The plot provides a visual representation of how strongly the variables are correlated, with 1 indicating a perfect positive correlation, -1 indicating a perfect negative correlation, and 0 indicating no correlation.
The following are some of the key similarities between correlation and linear regression:
The following are some of the key differences between linear regression and correlation:
Choosing between linear regression and correlation depends on your analysis goals:
You are a real estate analyst looking to understand the dynamics of the housing market in a particular city. You have a dataset containing information about recently sold properties, including their sale prices, square footage, location, age, and proximity to key amenities like schools, parks, and transportation.
Objective: Predicting House Prices
You would use linear regression to develop a model that predicts the sale price of a house based on these factors. By analyzing the coefficients of the regression model, you can understand how each factor, like square footage or age, impacts the sale price. For instance, the model could reveal how much the price increases for each additional square foot of space.
Objective: Understanding Relationships Between Features
Here, you would calculate correlation coefficients between different pairs of variables to understand their relationships. For example, you might find a strong positive correlation between square footage and sale price, indicating that larger homes tend to sell for higher prices. Similarly, you might explore the correlation between the age of the property and its sale price to see if newer properties tend to be more expensive.
In this fast-changing world, the ability to learn effectively is more valuable than ever. Whether…
Last updated: 13th May, 2024 Whether you are a researcher, data analyst, or data scientist,…
Last updated: 12th May, 2024 Data lakehouses are a relatively new concept in the data…
Last updated: 12th May 2024 In this blog, we get an overview of the machine…
Last updated: 12th May, 2024 In the world of generative AI models, autoencoders (AE) and…
Last updated: 7th May, 2024 Linear regression is a popular statistical method used to model…