In hypothesis testing, the level of significance is a measure of how confident you can be about rejecting the null hypothesis. This blog post will explore what hypothesis testing is and why understanding significance levels are important for your data science projects. In addition, you will also get to test your knowledge of level of significance towards the end of the blog with the help of quiz. These questions can help you test your understanding and prepare for data science / statistics interviews. Before we look into what level of significance is, let’s quickly understand what is hypothesis testing.
Hypothesis testing can be defined as tests performed to evaluate whether a claim or theory about something is true or otherwise. In order to perform hypothesis tests, the following steps need to be taken:
A detailed explanation is provided in one of my related posts titled hypothesis testing explained with examples.
The level of significance is defined as the criteria or threshold value based on which one can reject the null hypothesis or fail to reject the null hypothesis. The level of significance determines whether the outcome of hypothesis testing is statistically significant or otherwise. The significance level is also called as alpha level.
Another way of looking at the level of significance is the value which represents the likelihood of making a type I error. You may recall that Type I error occurs while evaluating hypothesis testing outcomes. If you reject the null hypothesis by mistake, you end up making a Type I error. This scenario is also termed as “false positive”. Take an example of a person alleged with committing a crime. The null hypothesis is that the person is not guilty. Type I error happens when you reject the null hypothesis by mistake. Given the example, a Type I error happens when you reject the null hypothesis that the person is not guilty by mistake. The innocent person is convicted.
The level of significance can take values such as 0.1, 0.05, 0.01. The most common value of the level of significance is 0.05. The lower the value of significance level, the lesser is the chance of type I error. That would essentially mean that the experiment or hypothesis testing outcome would really need to be highly precise for one to reject the null hypothesis. The likelihood of making a type I error would be very low. However, that does increase the chances of making type II errors as you may make mistakes in failing to reject the null hypothesis. You may want to read more details in relation to type I errors and type II errors in this post – Type I errors and Type II errors in hypothesis testing
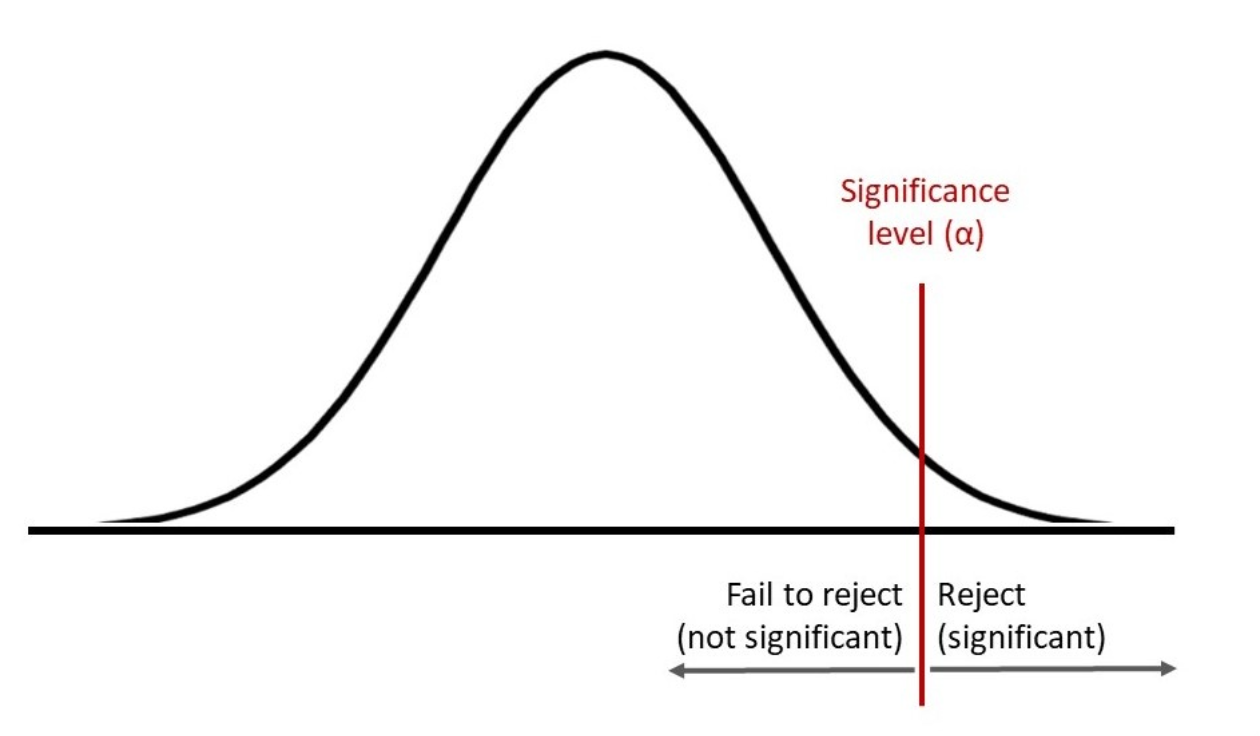
The outcome of the hypothesis testing is evaluated with the help of a p-value. If the p-value is less than the level of significance, then the hypothesis testing outcome is statistically significant. On the other hand, if the hypothesis testing outcome is not statistically significant or the p-value is more than the level of significance, then we fail to reject the null hypothesis. The same is represented in the picture below for a right-tailed test. I will be posting details on different types of tail test in future posts.
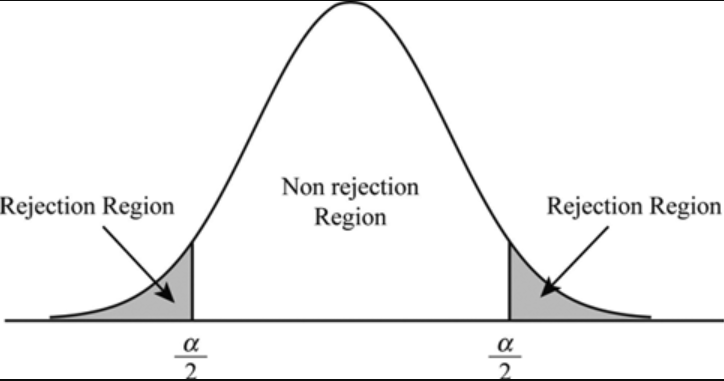
The picture below represents the concept for two-tailed hypothesis test:
For example: Let’s say that a school principal wants to find out whether extra coaching of 2 hours after school help students do better in their exams. The hypothesis would be as follows:
Now, let’s say that we conduct this experiment with 100 students and measure their scores in exams. The test statistics is computed to be z=-0.50 (p-value=0.62). Since the p-value is more than 0.05, we fail to reject the null hypothesis. There is not enough evidence to show that there’s a difference in the performance of students based on whether they get extra coaching.
While performing hypothesis tests or experiments, it is important to keep the level of significance in mind.
In hypothesis tests, if we do not have some sort of threshold by which to determine whether your results are statistically significant enough for you to reject the null hypothesis, then it would be tough for us to determine whether your findings are significant or not. This is why we take into account levels of significance when performing hypothesis tests and experiments.
Since hypothesis testing helps us in making decisions about our data, having a level of significance set up allows one to know what sort of chances their findings might have of actually being due to the null hypothesis. If you set your level of significance at 0.05 for example, it would mean that there’s only a five percent chance that the difference between groups (assuming two groups are tested) is due to random sampling error. So if we found a difference in the performance of students based on whether they take extra coaching, we would need to consider other factors that could have contributed to the difference.
This is why hypothesis testing and level of significance go hand in hand with one another: hypothesis tests help us know whether our data falls within a certain range where it’s statistically significant or not so statistically significant whereas the level of significance tells us how likely is it that our hypothesis testing results are not due to random sampling error.
The level of significance along with the test statistic and p-value formed a key part of hypothesis testing. The value that you derive from hypothesis testing depends on whether or not you accept/reject the null hypothesis, given your findings at each step. Before going into rejection vs non-rejection, let’s understand the terms better.
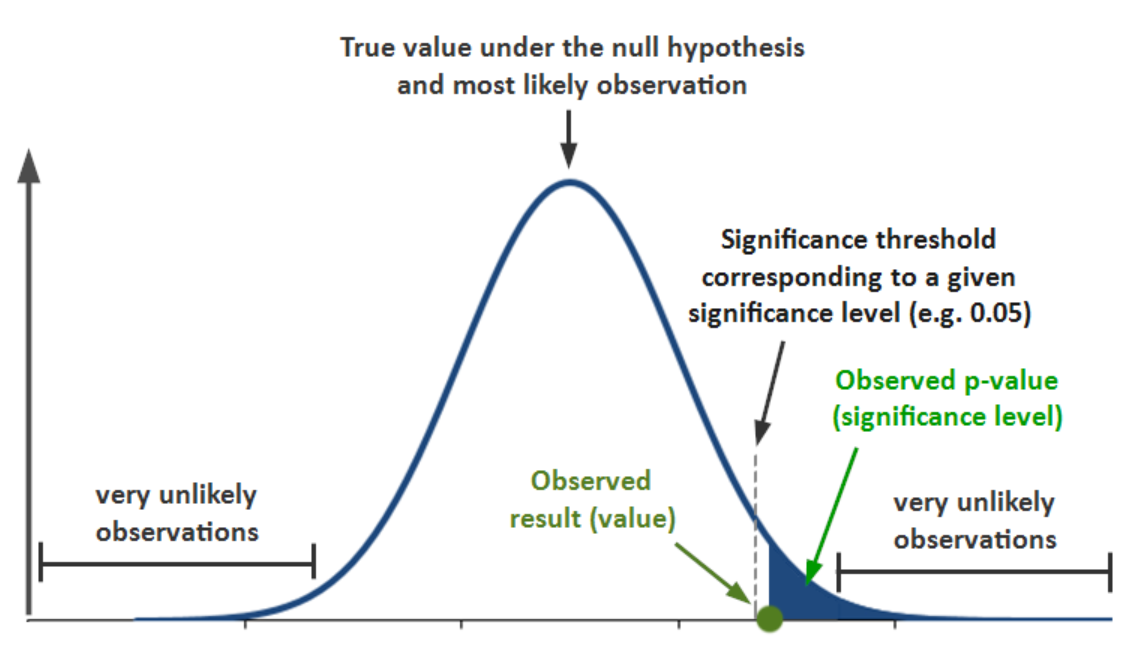
If the test statistic falls within the critical region, you reject the null hypothesis. This means that your findings are statistically significant and support the alternate hypothesis. The value of the p-value determines how likely it is for finding this outcome if, in fact, the null hypothesis were true. If the p-value is less than or equal to the level of significance, you reject the null hypothesis. This means that your hypothesis testing outcome was statistically significant at a certain degree and in favor of the alternate hypothesis.
If on the other hand, the p-value is greater than alpha level or significance level, then you fail to reject the null hypothesis. These findings are not statistically significant enough for one to reject the null hypothesis. The same is represented in the diagram below:
Here are some practice questions which can help you in testing your questions, and, also prepare for interviews.
Hypothesis testing is an important statistical concept that helps us determine whether the claim made about anything is true or otherwise. The hypothesis test statistic, level of significance, and p-value all work together to help you make decisions about your data. If our hypothesis tests show enough evidence to reject the null hypothesis, then we know statistically significant findings are at hand. This post gave you ideas for how you can use hypothesis testing in your experiments by understanding what it means when someone rejects or fails to reject the null hypothesis.
Last updated: 15th May, 2024 Have you ever wondered how your bank decides what to…
In this fast-changing world, the ability to learn effectively is more valuable than ever. Whether…
Last updated: 13th May, 2024 Whether you are a researcher, data analyst, or data scientist,…
Last updated: 12th May, 2024 Data lakehouses are a relatively new concept in the data…
Last updated: 12th May 2024 In this blog, we get an overview of the machine…
Last updated: 12th May, 2024 In the world of generative AI models, autoencoders (AE) and…
View Comments
Well explained with examples and helpful illustration
Thank you for your feedback
Well explained