Clustering is a popular unsupervised machine learning technique used in data analysis to group similar data points together. The K-Means clustering algorithm is one of the most commonly used clustering algorithms due to its simplicity, efficiency, and effectiveness on a wide range of datasets.
In K-Means clustering, the goal is to divide a given dataset into K clusters, where each data point belongs to the cluster with the nearest mean value. The algorithm works by iteratively updating the cluster centroids until convergence is achieved.
In this post, you will learn about K-Means clustering concepts with the help of fitting a K-Means model using Python Sklearn KMeans clustering implementation. You will also learn about its advantages and limitations.
Clustering represents a set of unsupervised machine learning algorithms belonging to different categories such as prototype-based clustering, hierarchical clustering, density-based clustering etc. K-means is one of the most popular clustering algorithm belong to prototype-based clustering category. The idea is to create K clusters (hence, K-means name) of data where data in each of the K clusters have greater similarity with other data in the same cluster. The algorithm works by iteratively assigning each data point to the cluster whose centroid is closest to it, and then updating the centroids based on the new assignments. The algorithm terminates when the assignment of data points to clusters no longer changes.
Here is a diagram representing creation of clusters using K-means algorithms.
In the above diagram, pay attention to some of the following:
Prototype-based clustering algorithms such as K-means clustering are based on one of the following:
The following represents the key steps of K-means clustering algorithm:
K-means clustering algorithm is an optimization problem where the goal is to minimise the within-cluster sum of squared errors (SSE). At times, SSE is also termed as cluster inertia. SSE is the sum of the squared differences between each observation and the cluster centroid. At each stage of cluster analysis the total SSE is minimised with SSEtotal = SSE1 + SSE2 + SSE3 + SSE4 …. + SSEn.
The below represents the objective function which needs to be minimized:
The following are some of the key features of K-means clustering algorithm:
However, there are also some limitations to K-Means clustering. One major limitation is that the algorithm is sensitive to initialization and can get stuck in local optima. In addition, the choice of K value (i.e., the number of clusters) can have a significant impact on the quality of the clustering results.
One of the key challenges in using K-Means clustering is determining the optimal number of clusters (K) to use. Choosing the right value of K is important, as it can significantly affect the quality of the clustering results. There are several methods for determining the optimal value of K, including:
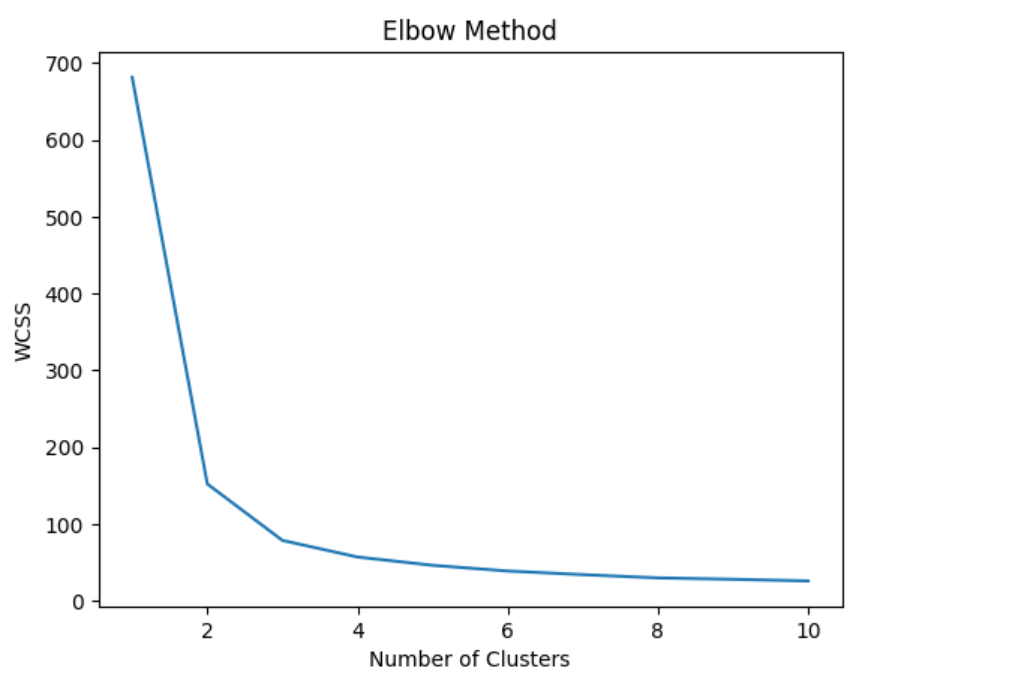
The technique used to find the most optimal value of K is draw a reduction in variation vs number of clusters (K) plot. Alternatively, one could draw the squared sum of error (SSE) vs number of clusters (K) plot. Here is the diagram representing the plot of SSE vs K (no. of clusters). In the diagram below, the point representing the optimal number of clusters can also be called as elbow point. The elbow point can be seen as the point after which the distortion/cluster inertia/SSE start decreasing in a linear fashion.
The silhouette method involves computing the average silhouette score for each value of K and selecting the value of K with the highest silhouette score. The silhouette score measures the quality of clustering based on the distance between data points within a cluster compared to the distance between data points in different clusters.
The gap statistic method involves computing the gap statistic for each value of K and selecting the value of K with the largest gap statistic. The gap statistic measures the difference between the within-cluster sum of squares for a given value of K and the expected within-cluster sum of squares for a random sample.
Now that we have a basic understanding of K-Means clustering and how to implement it in Python using Scikit-Learn, let’s see how we can apply it to a real-world dataset. For this purpose, we will be using the famous IRIS dataset, which contains information about different species of flowers.
Before training the model using K-means clustering, it is recommended to find appropriate value of K. The code below can be used to find the K value. we create an instance of the K-Means model for each number of clusters ranging from 1 to 10, and fit it to the IRIS dataset. The inertia_ attribute of the KMeans object returns the sum of squared distances of samples to their closest cluster center. We store these values in a list called wcss (short for “within-cluster sum of squares”).
from sklearn.datasets import load_iris
import matplotlib.pyplot as plt
from sklearn.cluster import KMeans

# Load IRIS Dataset
iris = load_iris()
X = iris.data

# Create the WCSS Plot against no. of clusters
wcss = []
for i in range(1, 11):
    kmeans = KMeans(n_clusters=i, init='k-means++', max_iter=300, n_init=10, random_state=0)
    kmeans.fit(X)
    wcss.append(kmeans.inertia_)
plt.plot(range(1, 11), wcss)
plt.title('Elbow Method')
plt.xlabel('Number of Clusters')
plt.ylabel('WCSS')
plt.show()
The above code creates the plot for wcss values against the number of clusters, and visually inspect the plot to determine the optimal number of clusters. The “elbow point” in the plot (i.e., the point where the rate of decrease in wcss starts to slow down) is often a good estimate for the optimal number of clusters.
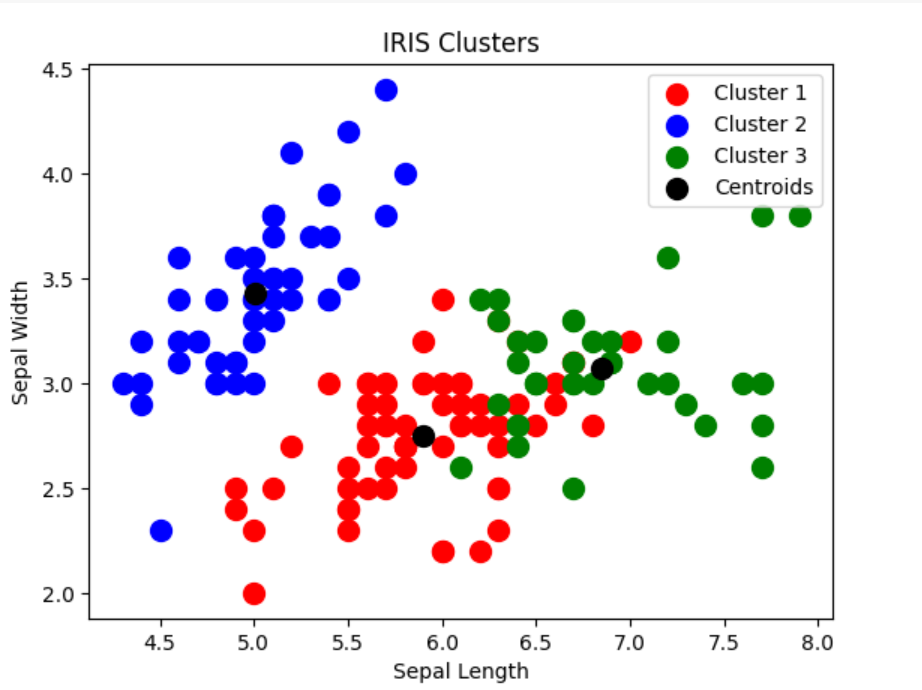
Based on the above, we choose the optimal number of clusters as 3. So, the value of K is chosed as 3. Now, we will create a K-Means model with 3 clusters and fit it to the IRIS dataset. The fit_predict method returns the cluster labels for each data point in the IRIS dataset, which we can use to visualize the clusters.
# Train K-Means Clusters
kmeans = KMeans(n_clusters=3, init='k-means++', max_iter=300, n_init=10, random_state=0)
y_kmeans = kmeans.fit_predict(X)

# Create the visualization plot of the clusters
plt.scatter(X[y_kmeans == 0, 0], X[y_kmeans == 0, 1], s = 100, c = 'red', label = 'Cluster 1')
plt.scatter(X[y_kmeans == 1, 0], X[y_kmeans == 1, 1], s = 100, c = 'blue', label = 'Cluster 2')
plt.scatter(X[y_kmeans == 2, 0], X[y_kmeans == 2, 1], s = 100, c = 'green', label = 'Cluster 3')
plt.scatter(kmeans.cluster_centers_[:, 0], kmeans.cluster_centers_[:, 1], s = 100, c = 'black', label = 'Centroids')
plt.title('IRIS Clusters')
plt.xlabel('Sepal Length')
plt.ylabel('Sepal Width')
plt.legend()
plt.show()
Here is how the plot would look like:
Pay attention to some of the following in relation to instantiation of K-means:
The following represents the key differences between K-means and K-means++ algorithm:
| K-Means | K-Means++ | |
|---|---|---|
| What is it? | K-Means is a clustering algorithm used in machine learning and data analysis to group data points into K distinct clusters based on the data points’ similarity. The ‘similarity’ is often determined using Euclidean distance. The initial choice of the cluster centers (centroids) is random, which can sometimes lead to sub-optimal clustering results. | K-Means++ is an improvement on the original K-Means algorithm. The primary difference is in the initialization of the centroids. K-Means++ uses a more sophisticated method for initial centroid selection which tends to result in better and more consistent clustering outcomes. |
| When to use it? | K-Means can be used when you need a quick and straightforward clustering solution and don’t have a particular concern about occasionally getting sub-optimal results due to random initialization of centroids. | K-Means++ should be used when you want more consistent, optimal clustering results. The initialization process of K-Means++ is especially beneficial when the dataset has a complex structure, or when the number of desired clusters (K) is large. |
| Real-world application | K-Means is used in various sectors like banking to segment customers, in health care for patient profiling, and in retail for inventory categorization. For instance, it’s commonly used in image compression and segmentation. | K-Means++ is used in applications that require better precision in data clustering. For example, it can be used in large-scale machine learning systems for processing and categorizing massive datasets such as geographical data analysis and social network analysis. |
Here is a great tutorial video on K-means clustering by StatQuest youtube channel.
Here is the summary of what you learned about K-Means clustering in general:
AI agents are autonomous systems combining three core components: a reasoning engine (powered by LLM),…
Artificial Intelligence (AI) has evolved significantly, from its early days of symbolic reasoning to the…
Last updated: 25th Jan, 2025 Have you ever wondered how to seamlessly integrate the vast…
Hey there! As I venture into building agentic MEAN apps with LangChain.js, I wanted to…
Software-as-a-Service (SaaS) providers have long relied on traditional chatbot solutions like AWS Lex and Google…
Retrieval-Augmented Generation (RAG) is an innovative generative AI method that combines retrieval-based search with large…