Following are three different aspects of software quality which could be tracked using Sonar Dashboard:
Following are different data elements that you could take from sonar dashboard and govern different aspects of software quality as mentioned below:
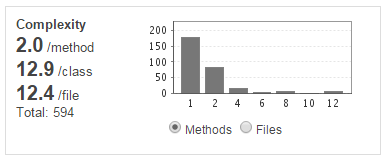
Complexity represents code complexity which, in turn, represents code cyclomatic complexity. Over a period of time, if complexity (of methods or class) increases, it depicts following:
Following diagram represents the code complexity in terms of cyclomatic complexity. In the following, code complexity per method is 2.0 and per class is 12.9. A code complexity of 10 or less is allowable for method or else, a code violation flag is raised.
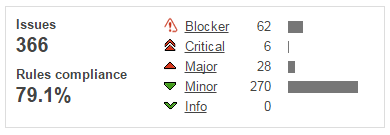
Sonar dashboard comes with rules compliance violations. One of the key things one could use this data is to watch out for security related violations. That said, one may want to use different security-related tool for this purpose. However, I have found it to be useful to watch out for security related coding violations as it serves the purpose sufficiently. From code quality perspective, it would be good to watch out for blocker and critical violations. It does come out with coding violations (against the configured code profile) developers ended up making with their code. Over a period of time, one could watch out for delta (changed) and report the team with frequently occuring violations. Following diagram represents the rules violations. Watch out for numbers related with blocker, critical, major, minor and info.
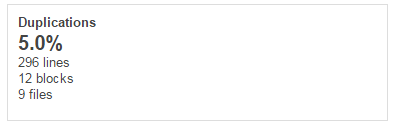
Duplication (represented in %) depicts the duplication of block of codes and files. It does impact the maintainability. Higher the duplication percentage, lower is the code maintainability. One should watch out for increase in code duplication and report to the team appropriately. Following diagram represents duplication in percentage.
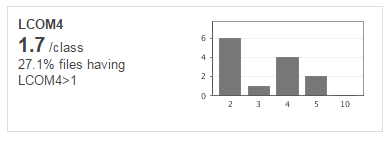
LCOM suspects are the files which has cohesion index (LCOM4) greater than 1. The value of LCOM4 is represnted in terms of number/class. For example, 2.5/class. This means that on an average, a class is doing 2.5 things. In simple words, these are files which violates single responsibility principle (SRP) which says that a class should do just one thing, or a class should have just one reason to change. Thus, higher percentage of files having LCOM4 > 1 impacts the maintainability in following ways:
Thus, one should watch out for LCOM4. Following diagram represents the LCOM4 index. Following represents the fact that 27.1 % files have LCOM4 > 1 which implies that 27.1% files tends to violate single responsibility principle.
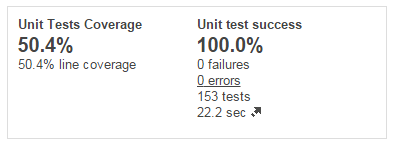
This is pretty straight forward. Test coverae is measured as unit test coverage. Higher the unit test coverage, higher the maintainability. One should watch out for ways unit test coverage changes and report to the team appropriately. Following diagram represents the unit test coverage.
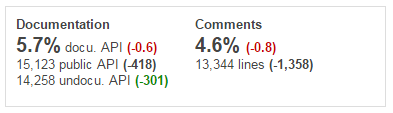
Very simple to understand, documentation is key component of making your code easy to understand, e.g., usability. It is denoted in percentage. Over a period of time, an increase in documentation would mean that code usability is increasing as code may be understood well with the help of documentation. Following diagram represents the documentation in percentage.
We’ve all been in that meeting. The dashboard on the boardroom screen is a sea…
When building a regression model or performing regression analysis to predict a target variable, understanding…
If you've built a "Naive" RAG pipeline, you've probably hit a wall. You've indexed your…
If you're starting with large language models, you must have heard of RAG (Retrieval-Augmented Generation).…
If you've spent any time with Python, you've likely heard the term "Pythonic." It refers…
Large language models (LLMs) have fundamentally transformed our digital landscape, powering everything from chatbots and…