How to Create Software Quality Metrics For Your Project

Well, if you are a software development partner for one or more of your customers, and you are looking forward for some of the following, you may want to adopt software quality metrics:

  1. Provide customers with software quality trending on various different software quality characteristic
  2. Monitor one or more projects for software quality

What are various different things that you could measure for quantifying software quality?

  • Defects Density (Functional Suitability): There are different data points you can use to measure defects density. Defects density can be defined to be one of the following:
    • Number of defects divided by total lines of code written per sprint/release
    • Number of defects divided by total size of sprints while working based on Agile methodology

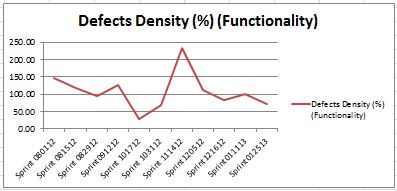
    Defects density can also be used to represent how consistently a functionality is delivered. You may want to make a point that functional suitability is one of the key software quality characteristics. Following is how could you measure the defects density:

    • Gather the number of defects from defect tracking system
    • Gather the lines of code using various different tools such as Sonar; Gather the size of sprint from agile tool.
    • Calculate the defect density based upon above formula.

    Following represents a diagram on what would it look like over different sprints:

    Defects Density

    How do you read above?

    Spikes represents the fact there were to many defects in one of the sprint. You may go and ask the team/scrum master and understand the reason behind the spike. Some of the reason may be complexity of the stories in the sprint, or, stories requiring the integration etc.

  • Code Complexity (Usability): If you want to have your code easy to read and understand, you may want to measure the McCabe code complexity in terms of cyclomatic complexity. Higher the code complexity, difficult is the understandability and readability of the code and hence, lower the code usability and vice-verse.One can get the code complexity data using tools such as Sonar.Following represents a diagram on what would code usability look like over different sprints:

    Code complexity

  • Unit Test Coverage (Testability): Unit test coverage represents the testability aspect of the code. Testability is a key characteristic of Maintainability and represents how easy is to test the code. Ease of testability also represents ease of changeability and hence high maintainability. Unit test coverage can be found using various different code coverage tool such as Cobertura etc.Following represents a diagram on what would testability look like over different sprints:

    Unit Test Coverage

  • LCOM Suspect (Re-usability): LCOM stands for Lack of Cohesion of Method. I came across this metric from tool called as Sonar. LCOM suspect represents percentage of classes which is suspected to serve multiple functionality and are thus, low in cohesion. And, lower the cohesion, lower the reusability.Following represents a diagram on what would LCOM Suspect look like over different sprints: 

    LCOM Suspect – Reusability

Ajitesh Kumar

I have been recently working in the area of Data analytics including Data Science and Machine Learning / Deep Learning. I am also passionate about different technologies including programming languages such as Java/JEE, Javascript, Python, R, Julia, etc, and technologies such as Blockchain, mobile computing, cloud-native technologies, application security, cloud computing platforms, big data, etc. For latest updates and blogs, follow us on Twitter. I would love to connect with you on Linkedin. Check out my latest book titled as First Principles Thinking: Building winning products using first principles thinking. Check out my other blog, Revive-n-Thrive.com

Recent Posts

Mean Squared Error vs Cross Entropy Loss Function

Last updated: 28th April, 2024 As a data scientist, understanding the nuances of various cost…

3 days ago

Cross Entropy Loss Explained with Python Examples

Last updated: 28th April, 2024 In this post, you will learn the concepts related to…

3 days ago

Logistic Regression in Machine Learning: Python Example

Last updated: 26th April, 2024 In this blog post, we will discuss the logistic regression…

5 days ago

MSE vs RMSE vs MAE vs MAPE vs R-Squared: When to Use?

Last updated: 22nd April, 2024 As data scientists, we navigate a sea of metrics to…

6 days ago

Gradient Descent in Machine Learning: Python Examples

Last updated: 22nd April, 2024 This post will teach you about the gradient descent algorithm…

1 week ago

Loss Function vs Cost Function vs Objective Function: Examples

Last updated: 19th April, 2024 Among the terminologies used in training machine learning models, the…

2 weeks ago