Correlation Concepts, Matrix & Heatmap using Seaborn
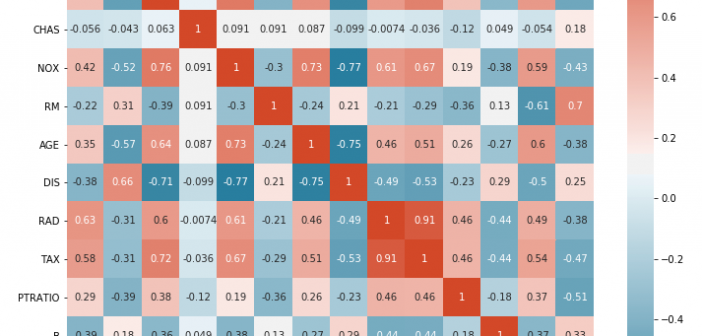
In this blog post, we’ll be discussing correlation concepts, matrix & heatmap using Seaborn. For those of you who aren’t familiar with Seaborn, it’s a library for data visualization in Python. So if you’re looking to up your data visualization game, stay tuned! We’ll start with the basics of correlation and move on to discuss how to create matrices and heatmaps with Seaborn. Let’s get started! Introduction to Correlation Correlation is a statistical measure that expresses the strength of the relationship between two variables. The two main types of correlation are positive and negative. Positive correlation occurs when two variables move in the same direction; as one increases, so do … Continue reading Correlation Concepts, Matrix & Heatmap using Seaborn