sample google chart
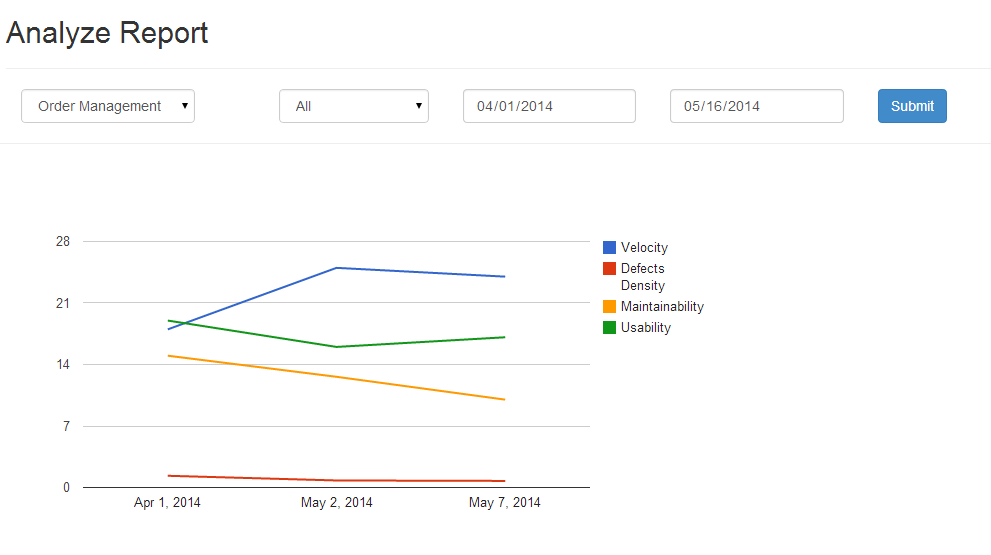
The article describes on some of the aspects related with Google Visualization APIs and how to quickly get started with it. To be able to do justice with this blog and more related blogs to come in near future, I went ahead and create a project, AgileSQM, on Google App Engine (cloud) and used following technologies to create a sample chart as shown below:
While getting started with Google Visualization APIs and working on AgileSQM project, following are some of the pages which helped me in a great manner:
Google Charts
https://developers.google.com/chart/
Starting point for developers to get some key learning around google visualization APIs to create charts
Google Visualization API Reference
https://developers.google.com/chart/interactive/docs/reference
The page presents key Javascript objects that helps in creating the plots. Some of these objects are following:
Data Source Java Library – Guide & Code Samples
https://developers.google.com/chart/interactive/docs/dev/dsl_about?csw=1
A Guide describes how to use the Google Visualization Data Source Library to implement a data source. One may check out several quick references on code samples and get it going.
Code Playground for Google Visualization
https://code.google.com/apis/ajax/playground/?type=visualization
An interactive web application where one could work with code samples and get their charts done before getting down to actual coding.
Following are some of the key aspects of code that one would require to be done while developing with visualization APIs:
UI-side code to create the charts
There are some key elements to pay attention to. They are following:
// Load Google AJAX API
<script type="text/javascript" src="https://www.google.com/jsapi"></script>
<script>
// Load the Google Visualization Library and Google chart libraries including the corechart package
google.load("visualization", "1", {
packages : [ 'corechart' ]
});
google.setOnLoadCallback(drawChart);
// Custom drawChart function to create the charts
function drawChart() {
try {
var data = new google.visualization.arrayToDataTable([
['Employee Name', 'Salary'],
['Mike', {v:22500, f:'18,500'}],
['Bob', 35000],
['Alice', 44000],
['Frank', 27000],
['Floyd', 92000],
['Fritz', 18500]
],
false); // 'false' means that the first row contains labels, not data.
var chart = new google.visualization.LineChart(document
.getElementById( "divId" ));
chart.draw(data, options);
} catch (err) {
alert( err.message );
}
}
</script>
<!-- HTML div container code to contain the drawn chart -->
<div>
<div id="divId" style="width: 800px; height: 400px;"></div>
</div> Server-side code to create Datatable/JSON object
One may need to create and send JSON object/string to client-side for creating the charts. One may use following technique:
– Use Google Visualization Data sources APIs to create DataTable and render JSON string using JSONRenderer object. Look at the code below:
DataTable data = new DataTable();
data.addColumn(new ColumnDescription("date", ValueType.TEXT, "Sprint Date"));
data.addColumn(new ColumnDescription("velocity",ValueType.NUMBER, "Velocity"));
data.addRowFromValues(dateStr, sqmdo.getVelocity());
return JsonRenderer.renderDataTable(data, true, true).toString();
– Create JSON string directly and send to client side
[adsenseyu1]
Last updated: 26th April, 2024 In this blog post, we will discuss the logistic regression…
Last updated: 22nd April, 2024 As data scientists, we navigate a sea of metrics to…
Last updated: 22nd April, 2024 This post will teach you about the gradient descent algorithm…
Last updated: 19th April, 2024 Among the terminologies used in training machine learning models, the…
Last updated: 19th April, 2024 Model parallelism and data parallelism are two strategies used to…
Last updated: 4th April, 2024 In machine learning, model complexity, and overfitting are related in…