Moving average definition & examples
In this post, you will learn about the concepts of the moving average method in relation to time-series forecasting. You will get to learn Python examples in relation to training a moving average machine learning model. The following are some of the topics which will get covered in this post:
The moving average is a statistical method used for forecasting long-term trends. The technique represents taking an average of a set of numbers in a given range while moving the range. For example, let’s say the sales figure of 6 years from 2000 to 2005 is given and it is required to calculate the moving average taking three years at a time. In order to calculate the moving average, one would take an average of 2000-2002, 2001-2003, 2002-2004, 2003-2005, and 2004-2006. Let’s understand it with example. In the table given below, the average value is computed by taking average of previous three years including the current one.
| Year | Sales (M$) | Moving Average (MA) |
| 2000 | 4 | NaN |
| 2001 | 7 | NaN |
| 2002 | 4 | 5 |
| 2003 | 9 | 6.67 |
| 2004 | 7 | 6.67 |
| 2005 | 10 | Needs to be predict assuming 2005 is the current year |
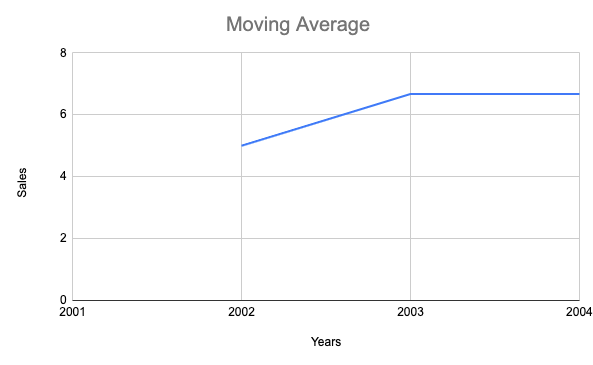
Plotting the moving average from the above table would look like the following. The moving average are usually plotted for visualisation purpose.
There are different variations of moving average technique (also termed as rolling mean) such as some of the following:
Interpreting a moving average graph that plots output of the moving average method in time series forecasting (as shown in the above plot) can be a useful tool for analysts, economists and investors to assess the current state of an asset or market. The concept behind this analysis is to identify trends in the data and make predictions about future outcomes based on these trends.
In simple terms, a moving average graph takes the average of several different points in the data set and then plots it over time. A longer-term moving average will give more emphasis to older data points, while a shorter-term one will look more closely at recent values. In case of stock price prediction, by examining how the line moves from period to period, investors can get a sense of where prices may be headed in the near future. For example, if prices were generally increasing with each new period up until now, then investors may expect prices to continue rising at least until there is clear evidence suggesting otherwise. On the other hand, if prices began dropping off sharply after some time period and continued to do so until present day, then this could indicate that downwards trend could continue.
It is important to note that while interpreting moving averages can provide helpful insights into future market fluctuations, it should not be treated as an infallible indicator. A single moving average line may not accurately depict all of the nuances and complexities of a given market environment; rather it should be used as one tool among many when trying to draw conclusions about potential price action going forward. As such, it may also be beneficial to take into account other types of technical analysis like support/resistance levels or momentum indicators when building out an entire trading strategy around a particular asset or security. Additionally, using multiple different moving averages with different lengths (i.e., short-, medium-, and long-term) can help investors better analyze how markets are behaving across various time horizons which could lead them to make wiser investment decisions about their portfolios going forward.
The moving average method is widely used in time-series forecasting because of its flexibility and simplicity. Unlike other methods, such as ARIMA or neural networks, it does not require an advanced knowledge of mathematics. This means that even those with basic statistical knowledge can use it to get reliable results.
The main advantage of the moving average method is that it takes into account all previous values when predicting future values. This helps to reduce the effect of outliers when making predictions and also makes it easier to identify seasonal patterns in a time-series data set. Furthermore, the weighting methodology used by the moving average method gives more importance to recent values over older ones, which is beneficial when predicting short-term trends.
In addition, the simple moving average (SMA) method is usually computationally faster than more complex methods such as exponential moving average (EMA). It also requires less parameters and can be used on shorter data sets. And finally, the SMA method has been proven to be effective in many applications such as stock market analysis as well as seasonal forecasting.
Overall, the moving average method is an effective tool for short-term forecasting due to its flexibility and ease of use. Its ability to take into account all past values when making predictions ensures accuracy while its ability to identify seasonal patterns means that it can be used effectively for long-term forecasting too. Furthermore, its computational speed and minimal parameters make it a popular choice for many applications.
Here is the Python code for calculating moving average for sales figure. The code that calculates the moving average or rolling mean is df[‘Sales’].rolling(window=3).mean(). The example below represents the calculation of simple moving average (SMA).
import pandas as pd
import numpy as np
#
# Create a numpy array of years and sales
#
arr = np.array([['2000', 4], ['2001',7],
['2002',4], ['2003',9],
['2004',7], ['2005',10]])
#
# Transpose array
#
arr_tp = arr.transpose()
#
# Create a dataframe
#
df = pd.DataFrame({'Years': arr_tp[0], 'Sales': arr_tp[1]})
#
# Calculate rolling mean
#
df['MA'] = df['Sales'].rolling(window=3).mean()
#
#
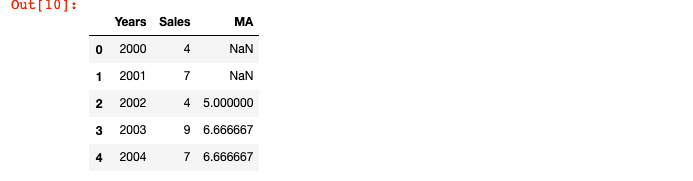
df.head()
This is how the output would look like:
In this fast-changing world, the ability to learn effectively is more valuable than ever. Whether…
Last updated: 13th May, 2024 Whether you are a researcher, data analyst, or data scientist,…
Last updated: 12th May, 2024 Data lakehouses are a relatively new concept in the data…
Last updated: 12th May 2024 In this blog, we get an overview of the machine…
Last updated: 12th May, 2024 In the world of generative AI models, autoencoders (AE) and…
Last updated: 7th May, 2024 Linear regression is a popular statistical method used to model…
View Comments
it is very helpfull article for calculation of your moving averages,you must keep up to help others.